






sumit_prajapat=# SELECT * FROM about WHERE honest = true;I take data the whole way: ingestion → Azure pipelines → SQL star schemas → Power BI dashboards → ML models — and I lead every dashboard with one quantified headline, not a wall of charts.
2+ years inside BFSI selling and servicing insurance products before analyzing them — now a freelance Data Analyst with Finonus Capital. B.Com graduate, Microsoft (PL-300 · AZ-900 · DP-900) and AWS certified.
-- The kind of analyst who measures e-commerce retention on customer_unique_id — the real person —-- and flags a dataset cut-off artifact before anyone misreads it as a downturn.-- and says "the data can't prove this campaign worked" when a placebo test fails.
Domains Retail & FMCG Finance & Insurance Healthcare E-Commerce · Seeking Data Analyst BI Developer Power BI Developer

sumit_prajapat=# EXPLAIN ANALYZE how_i_ship;
sumit_prajapat=# SELECT project, headline_metric
sumit_prajapat-# FROM   featured_work
sumit_prajapat-# ORDER  BY impact DESC;
# |
project |
headline_metric |
|---|---|---|
01 |
Grocery Retail Analytics NEW |
dbt · 1.46M transactions → 50.6% of coupons go to habitual buyers |
02 |
Healthcare Insurance Claims Analytics | 558,211 claims → 226× fraud concentration |
03 |
Mutual Fund Analytics Platform | 9.7M daily NAVs → 5-fund moderate-risk shortlist |
04 |
Olist E-Commerce Analytics | 112,650 records → ~97% one-time buyers exposed |
05 |
Customer Segmentation Engine | RFM + 3 models · Silhouette 0.52 · live app |
06 |
Queryscratch | 500 SQL questions · in-browser SQL sandbox |
(6 rows)
sumit_prajapat=# \x on -- expanded display: full detail per project
|
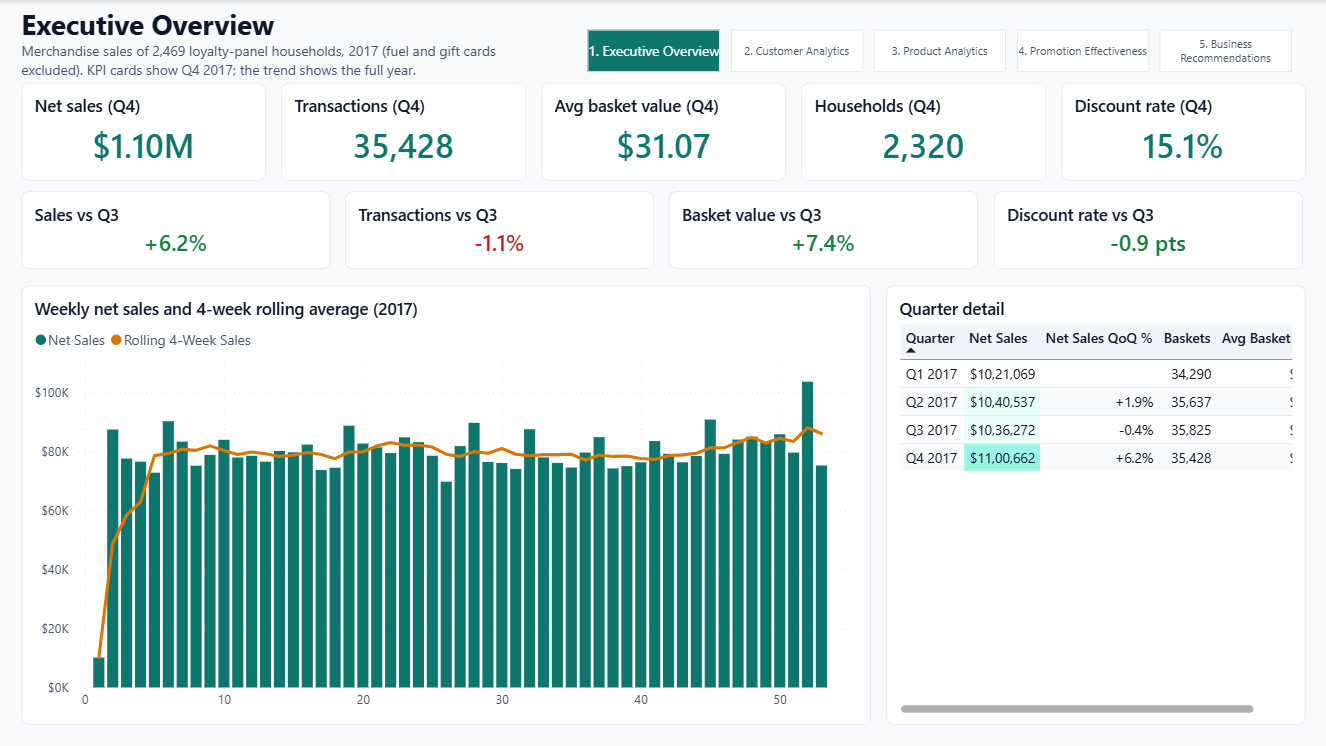
| 1.46M transactions |
50.6% habitual coupons |
102 dbt data tests |
58/58 DAX = SQL |
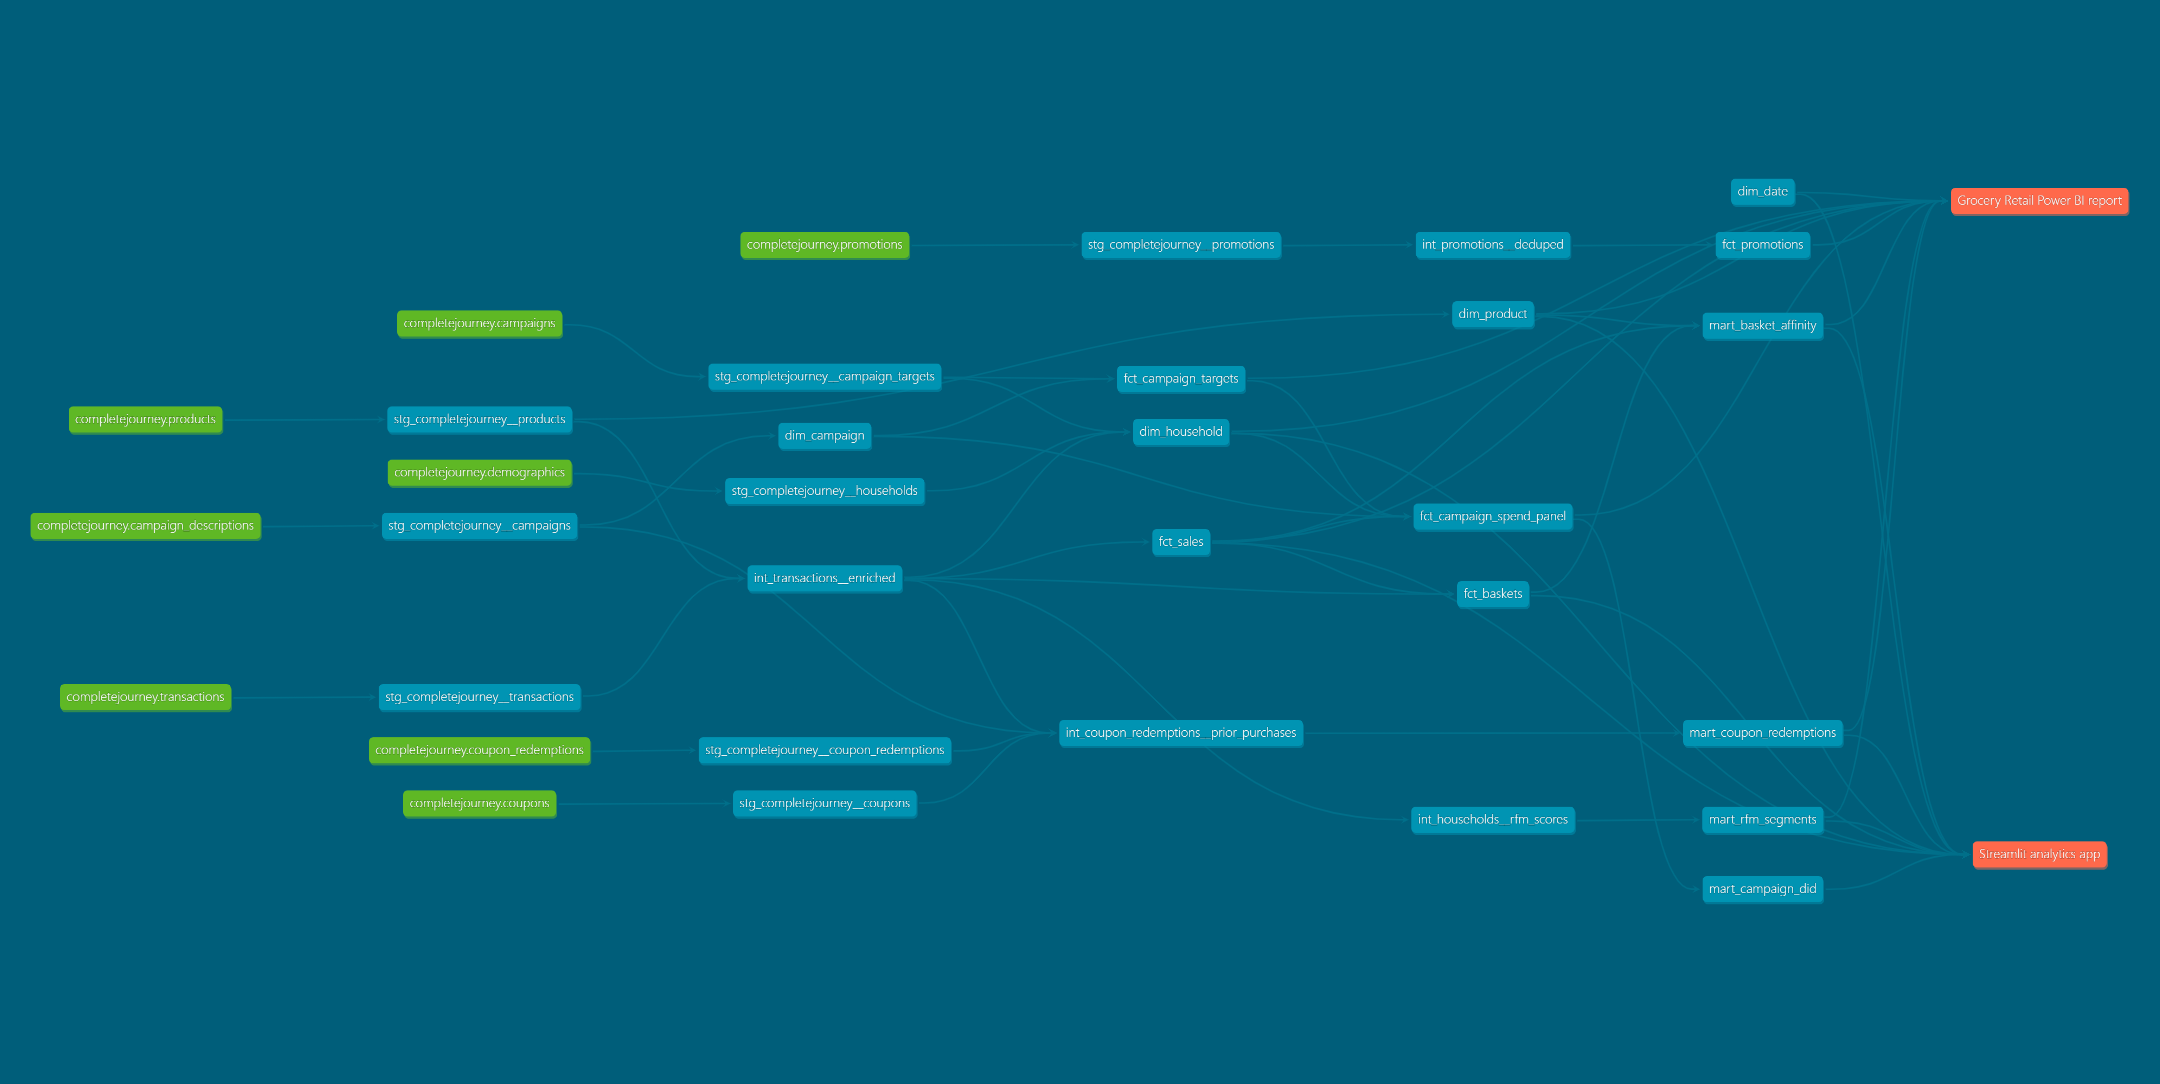
dbt project on DuckDB: 28 models (staging → intermediate → marts), 102 data tests + 6 unit tests, incremental fact tables and CI on every push → 13 SQL analyses → difference-in-differences with placebo tests → 5-page Power BI report (45 DAX measures) + Streamlit app with a cite-or-refuse “ask the data” assistant.
- Top 10% of households drive 34.2% of sales; 318 lapsing regulars hold 13.4%
- Display + mailer linked to 225% higher sales; placebo checks failed → recommended a 10% random holdout
- Moved to dbt with every table checked row by row against the old pipeline; SQL-vs-DAX reconciliation caught 3 DAX bugs
dbt DuckDB SQL Python statsmodels Power BI DAX Streamlit GitHub Actions
558,211 Medicare claims · 5,410 providers · where does the fraud concentrate?
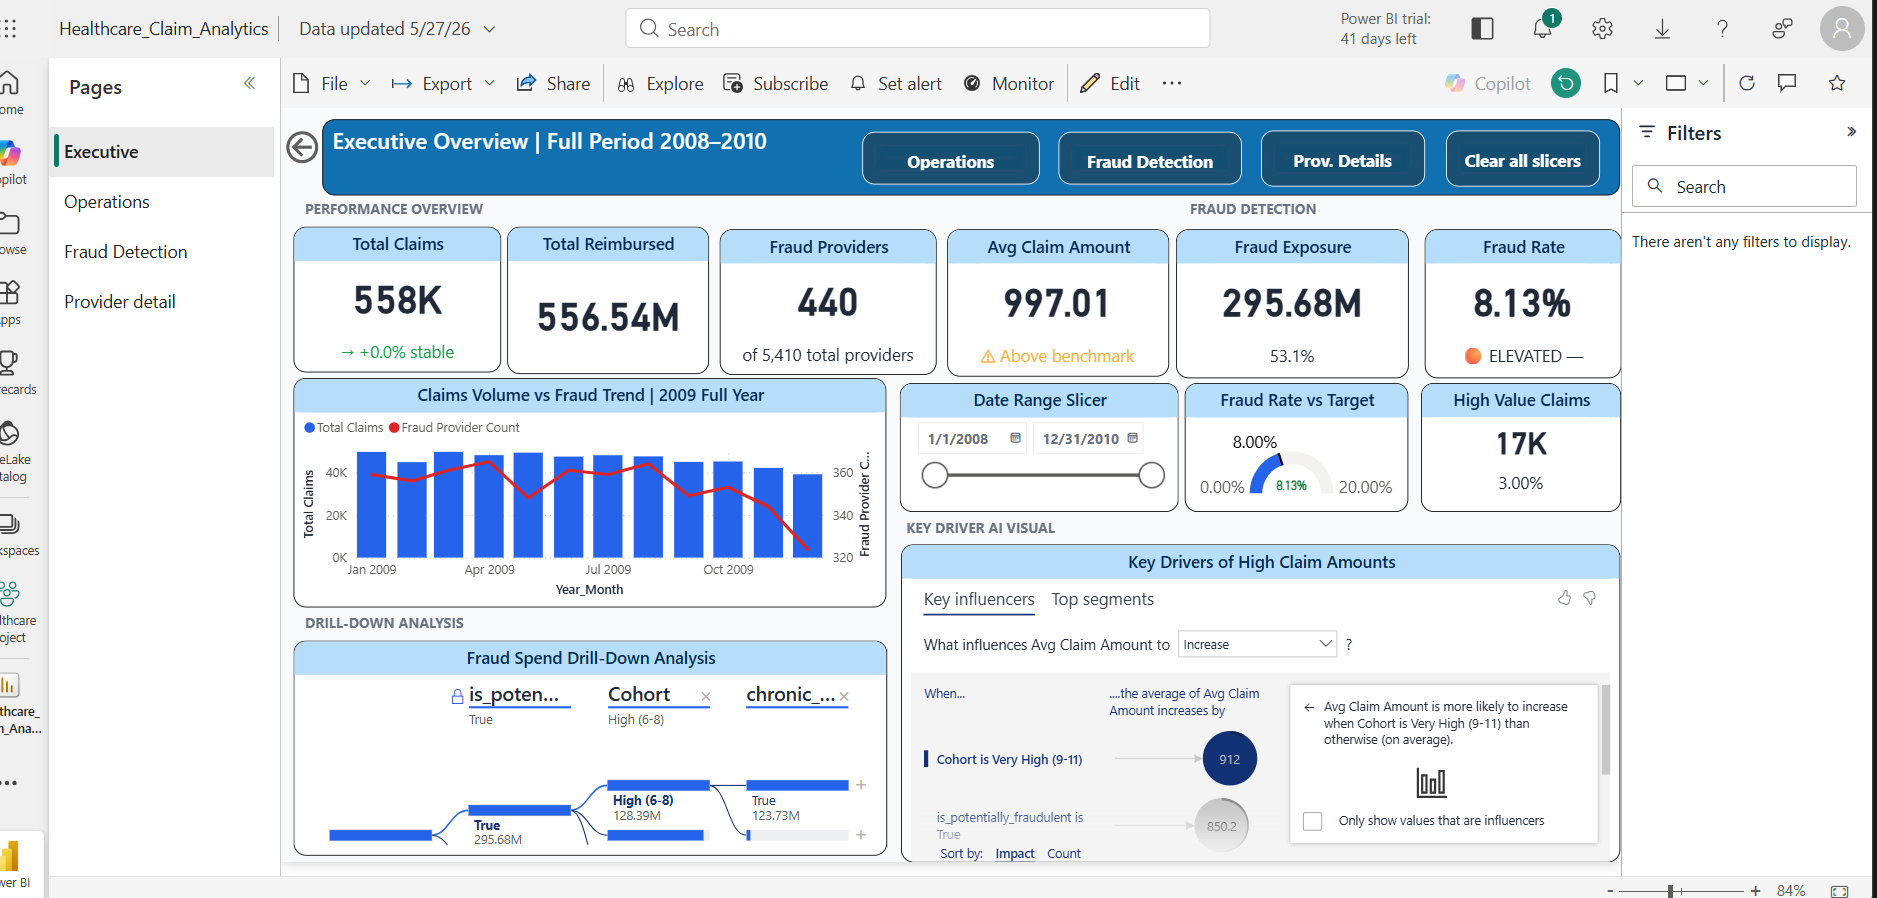
| 558K claims |
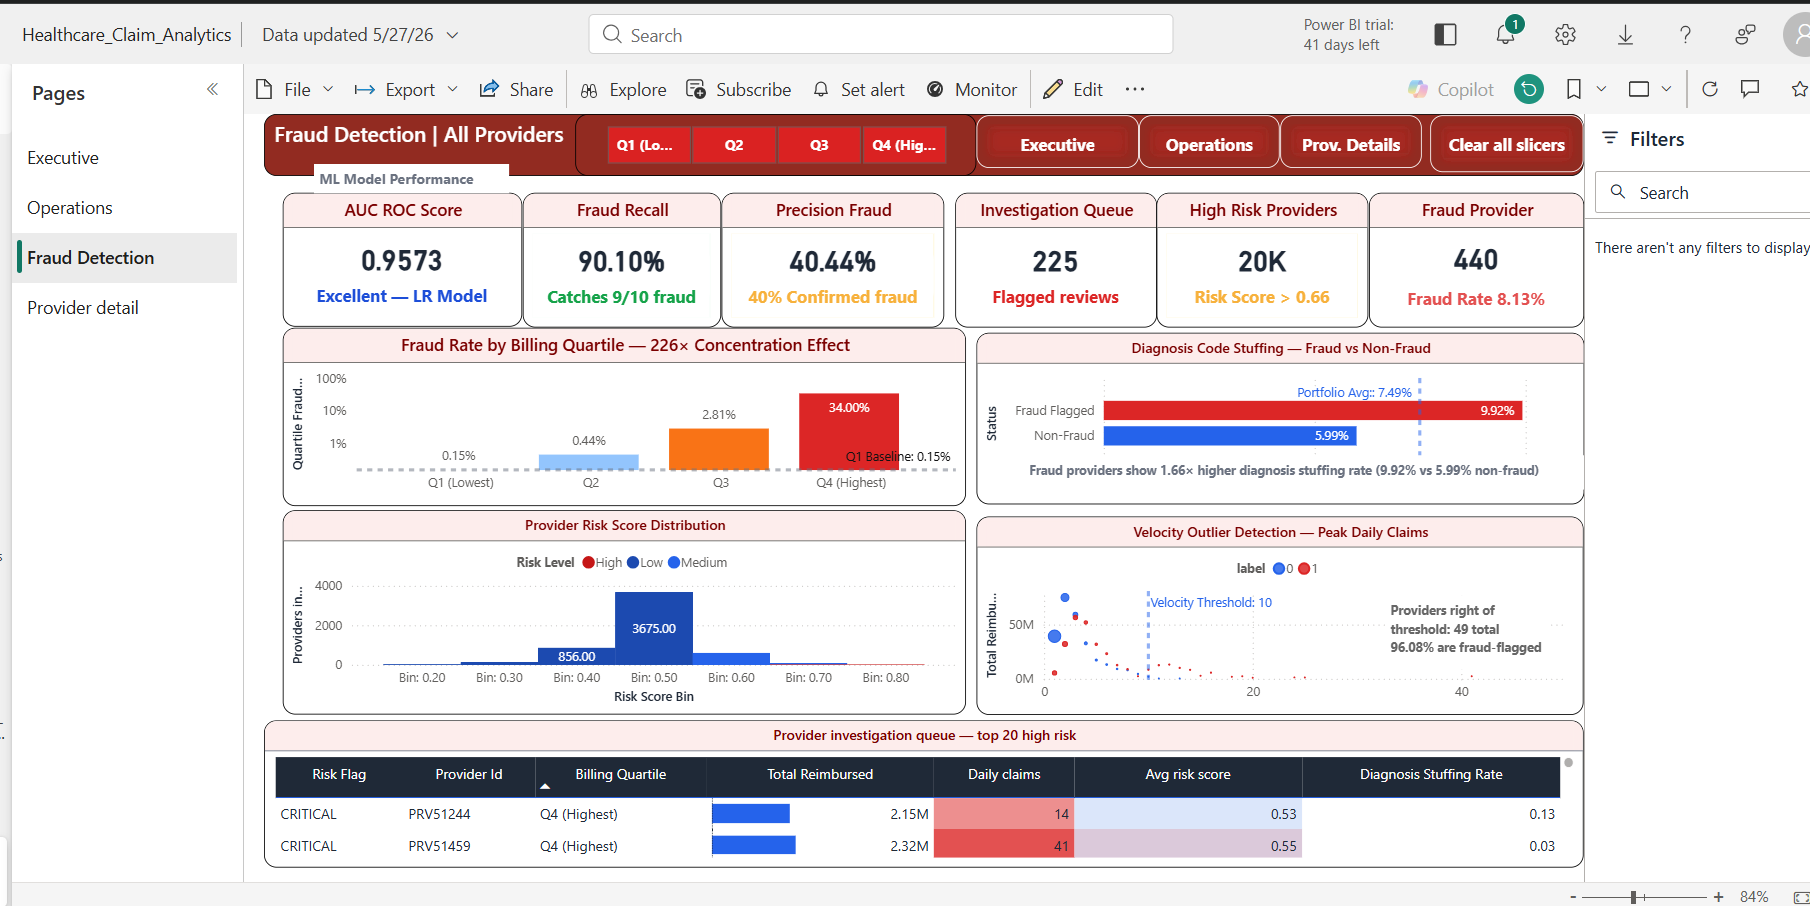
226× fraud concentration |
90.1% fraud recall |
$295.7M at 506 flagged providers |
Azure Blob → Data Factory → PostgreSQL 9-table warehouse (2.43M rows) → scikit-learn fraud model (AUC 0.9573) → 4-page Power BI report with provider drill-through.
- Top billing quartile: 34.02% fraud rate vs 0.15% in the bottom quartile
- Audit list: top 50 providers (0.9%) cover 35.3% of flagged dollars, and all 50 are flagged
- Threshold tuning lifted XGBoost recall from 65% to 93%, at the cost of a larger review queue
- 96% of high-velocity providers (>10 claims/day) are fraud-flagged
- Fraud providers file 9+ diagnosis codes 1.66× as often — diagnosis stuffing
Azure ADF PostgreSQL Python scikit-learn Power BI DAX
9.7M daily NAVs · 8,620 live schemes · which 5 funds suit a moderate-risk client?
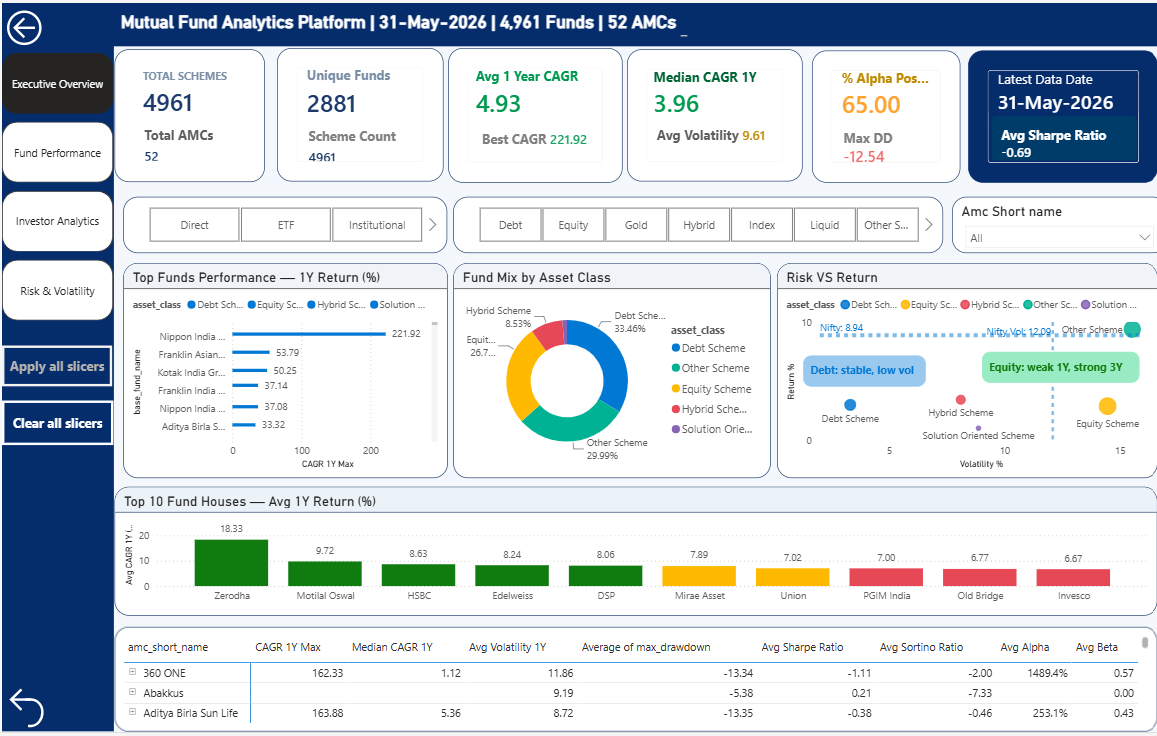
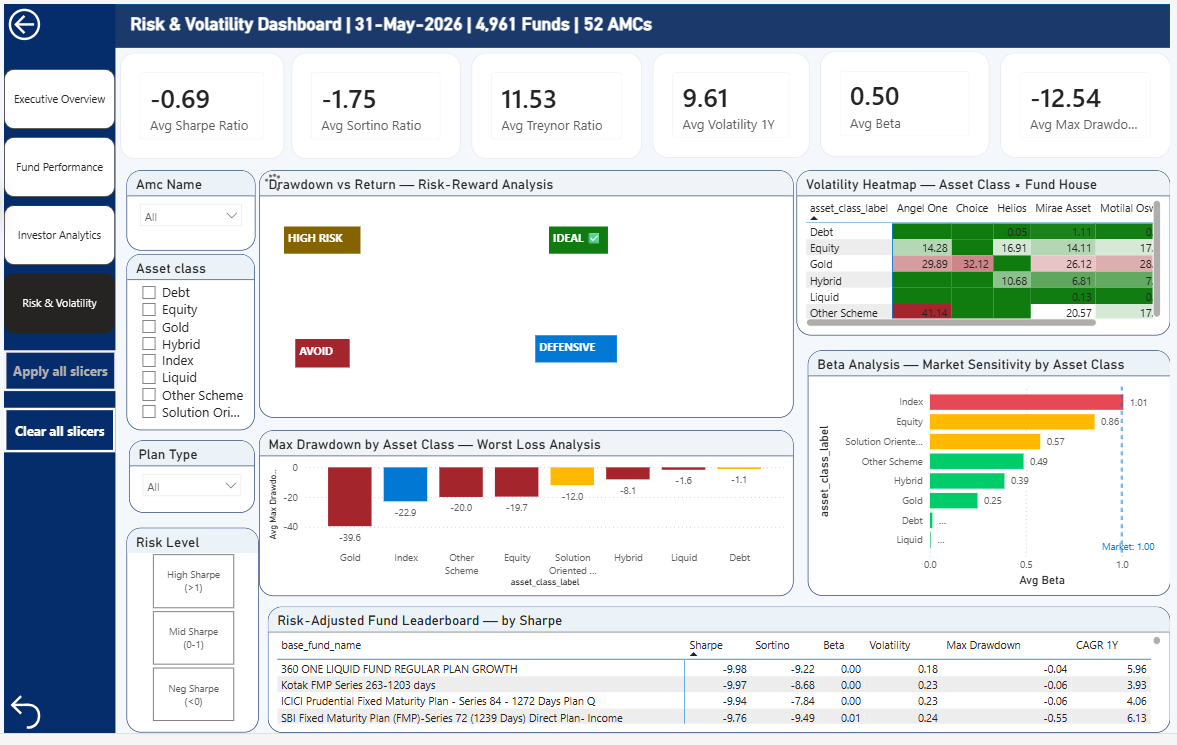
| 8,620 live schemes |
9.7M daily NAV rows |
179 → 5 funds shortlisted |
−3.6% worst fall vs −4.8% for peers |
Yahoo Finance + AMFI → Azure Blob → Data Factory → Azure SQL star schema → risk suite in Python → 4-page Power BI report and a live Streamlit app.
- Tested the 5-fund shortlist out of sample: return matched peers (9.6% vs 9.5%), with a shallower worst fall in 11 of 11 overlapping windows
- Trend exploration, not forecasting: Prophet lost to a no-change baseline at 30, 60 and 90 days, so it only describes trends
- Every project number comes from one generated file, and a test fails if the README drifts from it
Azure ADF Azure SQL Python Prophet Power BI Streamlit
112,650 sales records · 96,096 real customers · why don't buyers come back?
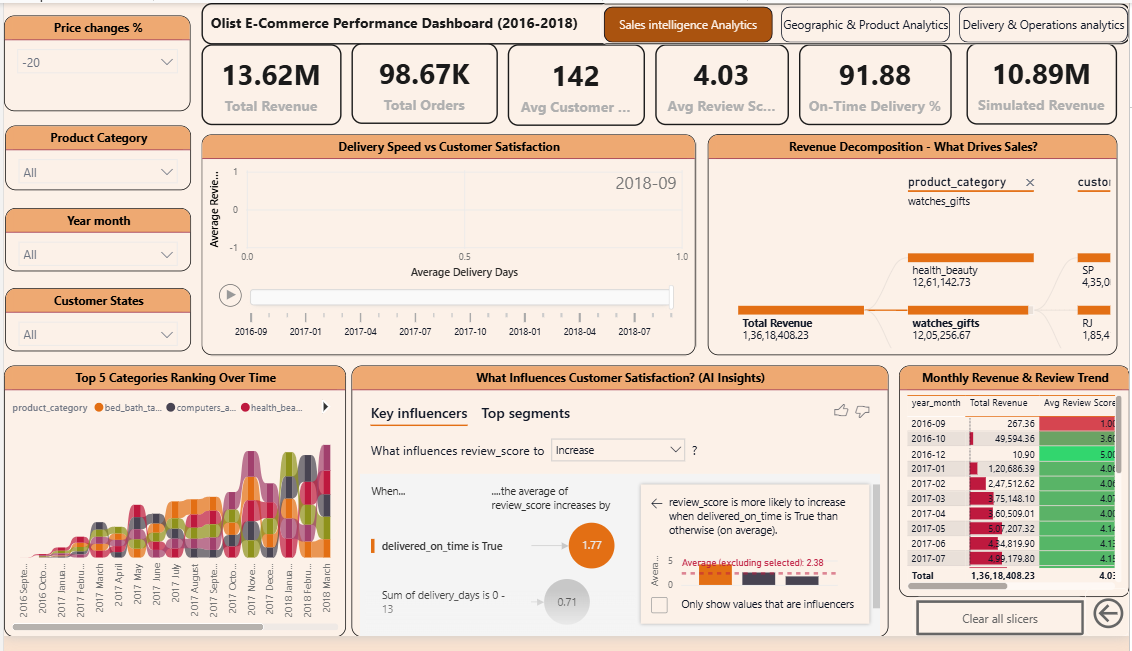
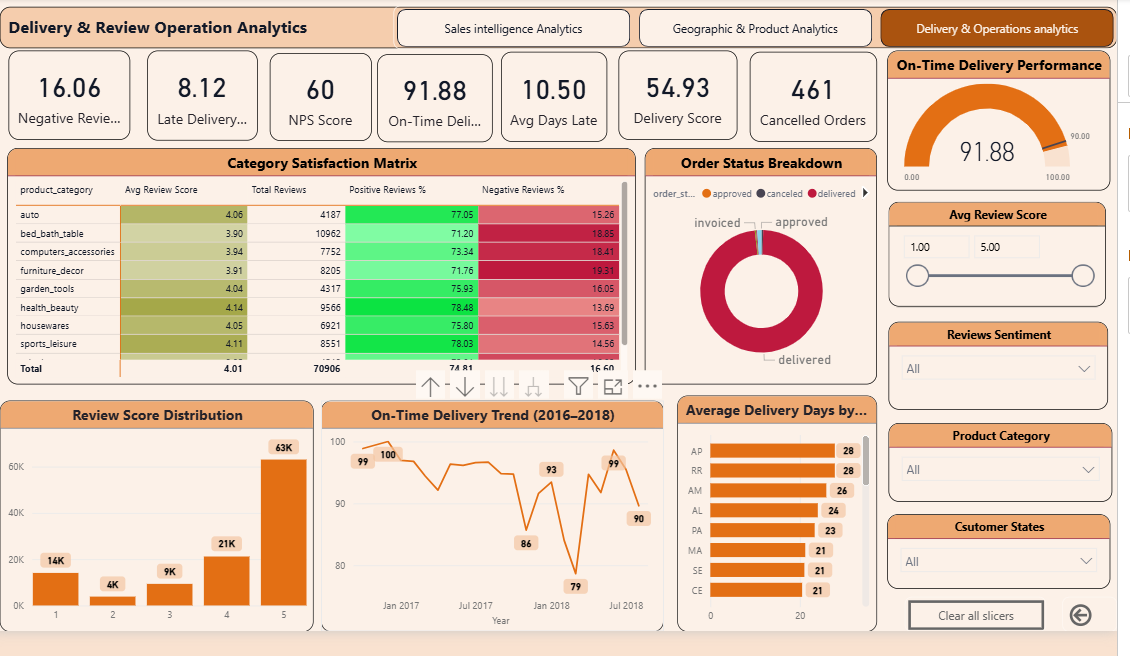
| 112,650 sales records |
~97% one-time buyers |
91.88% on-time delivery |
40+ DAX measures |
8 raw tables → Azure Blob → Data Factory → Azure PostgreSQL star schema (4 dims + 1 fact) → 3-page Power BI report with decomposition tree, key influencers and what-if price simulation.
- Retention measured on customer_unique_id — only ~3% of real customers ever reorder
- São Paulo drives 38.3% of revenue; health_beauty leads at R$1.4M
- Remote AP state waits 28 days vs a 21-day average delivery
Azure ADF PostgreSQL SQL Power BI DAX Power Query
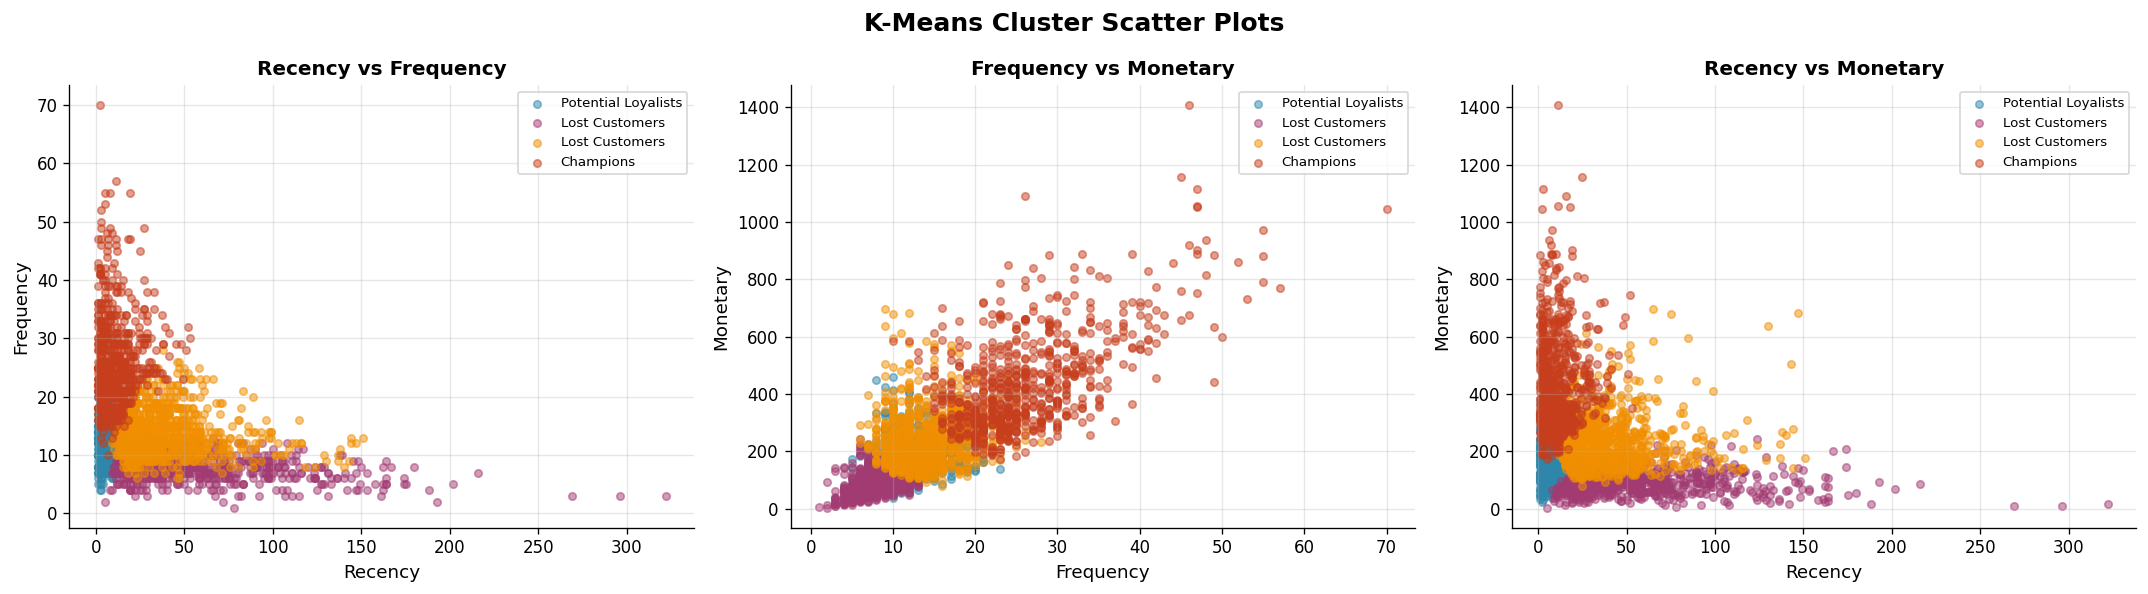
~541K retail transactions · RFM + 3 clustering models · who is worth keeping?
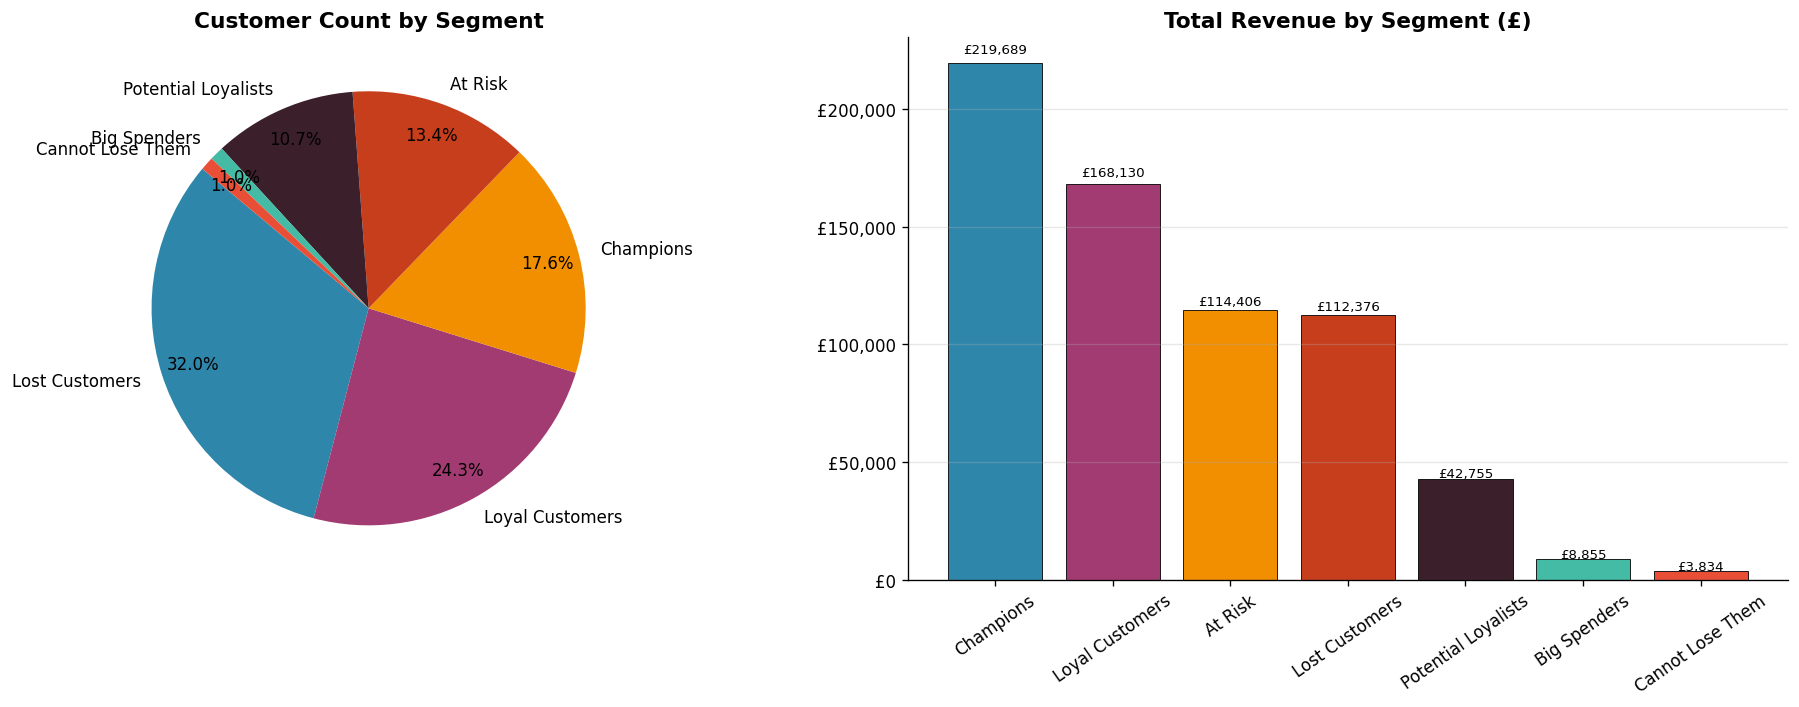
| 541K transactions |
0.52 silhouette score |
~40% revenue from top 15% |
£127K recoverable revenue |
UCI Online Retail data → cleaning → RFM scoring → K-Means vs Hierarchical vs DBSCAN benchmarked head-to-head → PCA, CLV and cohort analysis → interactive Streamlit app.
- Champions are 8× the lifetime value of lost customers
- Cohorts lose 70%+ of customers by month 3 — the window to act
- K-Means (K=4) beat Hierarchical and DBSCAN on compact, explainable clusters
Python Pandas scikit-learn PCA Streamlit
500 SQL challenges · runs in the browser · free for students

| 500 SQL challenges |
0 installs needed |
WASM in-browser engine |
Free for students |
A free SQL learning platform: hand-crafted challenges from a first SELECT to recursive CTEs, with real queries run client-side via sql.js / WebAssembly and instant exact-output feedback.
- No server round-trip — every query runs inside the browser
- Learn, playground, mock-interview and practice tracks, beginner → expert
- Streaks and per-user progress on Supabase auth
SQL sql.js WebAssembly Supabase JavaScript
sumit_prajapat=# SELECT category, tools FROM toolkit GROUP BY category;category |
tools |
|---|---|
business_intel |
Power BI DAX Power Query Excel |
data_engineering |
SQL dbt PostgreSQL DuckDB Azure Data Factory Star Schema ETL |
python_ml |
Python Pandas NumPy scikit-learn statsmodels Prophet Streamlit |
cloud_and_ops |
Microsoft Azure AWS Git GitHub Actions Jupyter |
sumit_prajapat=# SELECT * FROM certifications WHERE verified = true;credential |
issuer |
status |
|---|---|---|
| ★ PL-300 · Power BI Data Analyst Associate | Microsoft | → verify |
| AZ-900 · Azure Fundamentals | Microsoft | → verify |
| DP-900 · Azure Data Fundamentals | Microsoft | → verify |
| Cloud Practitioner | AWS | → verify |
| Investment Foundations | CFA Institute | → verify |
| SQL Certified | HackerRank | → verify |
