


Measure what a vulnerability is worth to your business, not how severe it is in the abstract.
Your scanner tells you a CVE exists and that NVD rated it 9.8. It does not know that the affected library sits on a decommissioned lab box, or that the unexciting 6.1 is on the payment gateway and in PCI scope. So everything critical looks equally urgent, and the queue gets worked in the wrong order.
Vulnometry takes the same public data your scanner uses, combines it with a description of what you actually run, and gives you one answer per place you run the affected thing.
$ vulnometry compare CVE-2021-44228

CVE-2021-44228: one CVE, 3 answers
Asset            BEI  Verdict     Threat  Reach  Conseq.  Due
checkout-api   928.9  Contain       1.00   0.90     1.00  2026-09-04
internal-wiki  164.5  Schedule      1.00   0.16     0.41  2027-01-06
ml-sandbox       0.0  Accept        1.00   0.00     0.22  -

Threat is identical everywhere. The 929-point spread is entirely reachability
and consequence. That difference is what knowing your own estate buys you.
Same CVE, three jobs, three dates, three owners.
Bulk runs write the same measurement out as an annotated workbook and a self-contained HTML dashboard for the people who do not live in a terminal.
- Install
- Five-minute tour
- Reading the output
- How the score works
- Describing what you run
- Bulk analysis
- Dashboard
- Commands
- Using a model
- Other surfaces
- Resilience
- Limits
Requires Python 3.10 or newer.
pip install vulnometryThe optional extras are only needed for specific backends:
pip install 'vulnometry[bedrock]'    # + AWS Bedrock
pip install 'vulnometry[service]'    # + the REST server
pip install 'vulnometry[all]'        # both
To work on the code instead, clone it and use the install script, which sets up a virtualenv and runs the tests:
git clone https://github.com/san3ncrypt3d/vulnometry.git
cd vulnometry
./install.sh                    # Windows: .\install.ps1
source .venv/bin/activate       # Windows: .venv\Scripts\activate
No API keys are required for anything. Two free ones make it considerably faster, and
vulnometry doctor will tell you if you need them:
export NVD_API_KEY=...    # nvd.nist.gov/developers/request-an-api-key, raises 5 req/30s to 50
export GITHUB_TOKEN=... # any GitHub token, no scopes needed, for advisory lookupsvulnometry doctor # check the feeds are reachable
vulnometry inventory init # describe what you run, in one YAML file
vulnometry compare CVE-2021-44228 # one CVE, one answer per assetTo try it against a worked example estate before describing your own:
curl -O https://raw.githubusercontent.com/san3ncrypt3d/vulnometry/main/examples/vulnometry.yaml
vulnometry compare CVE-2021-44228
Then point it at a real scanner export:
vulnometry import ~/Downloads/scan.xlsxThat reads your scanner export, scores every row against your inventory, and writes an annotated workbook plus a self-contained HTML dashboard into the current directory.
Step-by-step version with explanations: QUICKSTART.md.
Every row of every report has the same shape.
| Column | Meaning |
|---|---|
| BEI | Business Exposure Index, 0 to 1000. The headline number. |
| Verdict | What to do about it. See the table below. |
| Threat | 0 to 1. How likely anyone is to try. |
| Reach | 0 to 1. How likely they can get to it in your environment. |
| Conseq. | 0 to 1. How much it costs you if they succeed. |
| Due | The date implied by the verdict and your policy. |
BEI is the three factors multiplied together, so a zero in any one of them takes the whole score to zero. That is deliberate: something nobody can reach is not urgent, however frightening its CVSS score.
| BEI | Verdict | What it means |
|---|---|---|
| >= 700 | Contain | Act now, outside the normal change process |
| >= 400 | Remediate | Fix within this sprint |
| >= 150 | Schedule | Queue for the next maintenance window |
| < 150 | Accept | No action warranted; record the decision |
Due dates come from policy rather than the score alone: tier 1 assets halve the window, regulated systems get 60% of it, production 80%.
Every assessment carries the reasoning that produced it, so you can see which feed contributed
what. Run vulnometry measure CVE-2021-44228 --asset checkout-api for the long form.
BEI = 1000 * Threat^0.8 * Reachability^0.7 * Consequence^0.6
Three questions, multiplied rather than summed:
| Factor | Question | Built from |
|---|---|---|
| Threat | Will anyone actually try? | CISA KEV (observed exploitation), FIRST EPSS (predicted), exploit maturity |
| Reachability | Can they get to it here? | CVSS attack vector, complexity, privileges, UI, times your topology |
| Consequence | What does it cost us? | CVSS impact sub-metrics, times asset tier, data class, regulatory scope |
Multiplication is the design decision. A weighted sum lets a frightening CVSS carry a finding nobody can reach, which is how teams end up patching lab machines while something dull sits on the gateway. Multiplied, any factor can veto. That falls out of the arithmetic, so there is no override branch in the code and nothing to argue about in a review meeting.
The cost is that unknowns matter. If you have not described an asset, vulnometry treats the gaps as uncertainty rather than safety, and scores it pessimistically. That is on purpose: losing a finding is worse than over-ranking one.
The full derivation, including every weight and exponent and the reasoning behind it, is in docs/SCORING.md. Disagreements about the weights are welcome and make good issues.
This is the part that makes the tool useful, and it is one YAML file. A minimal one:
assets:
  - name: checkout-api
    tier: 1
    internet_exposed: true
    data_classification: restricted
    regimes: [pci-dss]
    owner: payments@example.com
    components: ["org.apache.logging.log4j*"]
Only name is required. Every other field sharpens the measurement:
| Field | Effect |
|---|---|
tier |
1 mission-critical, 2 business-important, 3 supporting. Raises consequence and tightens the due date. |
internet_exposed |
Raises reachability considerably. |
deployed: false |
Takes reachability to zero, so exposure goes to zero. |
data_classification |
public, internal, confidential or restricted. Raises consequence. |
regimes |
pci-dss, hipaa, sox, gdpr and so on. Raises consequence and tightens the date. |
components |
Glob patterns matching what the asset runs, so findings attach automatically. |
owner |
Who the action plan assigns the work to. |
compensating_controls |
Discounts reachability without zeroing it. |
Leave a field out rather than guessing. Unknown is treated as uncertainty, which is safer than a confident wrong answer.
vulnometry inventory init writes a commented template to start from, and
vulnometry inventory show prints what it parsed. Vulnometry finds the file automatically if it
is named vulnometry.yaml and sits in the working directory, or you can pass --inventory.
If the business context already lives in a CMDB extract, an application register or a spreadsheet a security team maintains, point vulnometry at the export plus a mapping file that says which column is which. Nothing in the mapping is tool-specific; the header names and value codes are all yours.
vulnometry inventory import assets.csv --map mapping.yaml -o vulnometry.yaml   # freeze to YAML
vulnometry import scan.xlsx --inventory assets.csv --inventory-map mapping.yaml  # or use it directly
A three-line mapping already does something useful:
columns:
  name:  Service               # your header -> vulnometry's field
  tier:  Tier
  owner: Team Contact
values:
  tier: {"tier 1": 1, "tier 2": 2, "tier 3": 3}   # translate your codes
Fuller mappings pull hostnames out of a URL column, split a multi-value cell, derive
internet_exposed from a couple of yes/no columns, and route a scanner's own project names into
a new aliases list so findings attach even when the scan never uses the asset's own name.
Re-running merges: mapped columns are refreshed from the export, anything you added by hand is
kept. A complete worked example — the CSV, the mapping, the resulting inventory, and a
line-by-line account of how each column is read — is in
docs/INVENTORY-IMPORT.md, runnable from
examples/asset-export.csv and
examples/inventory-mapping.yaml.
Most vulnerability work arrives as a spreadsheet somebody was emailed.
vulnometry import nessus-export.xlsx --preview      # check column detection first
vulnometry import nessus-export.xlsx                # measure everything
Always run --preview first. It shows which columns were recognised, without spending any API
calls, so you find out immediately if the CVE column was missed.
Columns are detected by header against an alias table, and the header row is found rather than assumed, because exports routinely carry a title block above the table. A row listing several CVEs becomes several findings. Assets are matched to your inventory by name, hostname glob or component glob.
Reads .xlsx, .xls, .csv and .tsv, plus native JSON from Trivy, Grype, Snyk, OSV-Scanner,
Dependabot and SARIF. vulnometry sweep handles lockfiles and SBOMs: requirements.txt,
poetry.lock, package-lock.json, go.mod, Gemfile.lock, Cargo.lock, pom.xml, CycloneDX and SPDX.
The workbook it writes has five sheets: Findings (every row, colour-coded, filterable, frozen header, with a plain-language Rationale column), Action Plan (only what needs doing, sorted by due date), Accepted (everything below the action threshold, with the rationale, the EPSS score and its date, internet exposure, evidence gaps, model version and timestamp, plus blank columns for who accepted it, the review-by date and what should reopen it), By Owner (workload per team), and Method (how the numbers were produced).
When a finding matches no asset in your inventory it is still scored (pessimistically) and
still actionable: every report keeps the name the scanner gave it — a Scanner ref column in the
workbook, and a ~name fallback everywhere else — so you always know which project or host to
go and look at.
Every bulk report ends with a funnel:
What the analysis removed
  ├─ 4000 scanner findings
  ├─ 500 unique CVEs
  ├─ 1600 CVE x asset decisions  (60% scanner duplication removed)
  ├─ 1400 would be urgent on CVSS alone (>= 7)
  ├─ 40 actionable findings after exposure analysis  (97% of the severity queue removed)
  └─ 12 upgrades to actually perform
There are two different reductions in there and it matters which one you quote.
Scanner duplication is bookkeeping, not analysis. A scanner reports one row per (CVE, project, manifest), so the row count is inflated before anyone has judged anything. Collapsing it is arithmetic. Claiming credit for it would be dishonest.
The reduction that is the analysis is measured against the counterfactual — how many of
these a severity-driven programme would have queued as urgent, versus how many the exposure
model says to act on. That is the claim the tool has to stand behind, so analysis_reduction_pct
is a percentage of the severity queue, never of the raw row count.
The last line is the cost. One dependency bump closes every CVE that package carries, so distinct (asset, package) upgrades is what the work actually is. A plan built on upgrades is a plan somebody can finish.
| Key | What it counts |
|---|---|
findings_assessed |
Rows measured, after de-duplicating identical (CVE, asset, host, component) |
unique_cves |
Distinct vulnerabilities, however many places they appear |
cve_asset_pairs |
Distinct risk decisions: one CVE, in one place you run it |
urgent_on_severity_alone |
CVSS base >= 7.0 — the severity-driven baseline |
actionable_findings |
Contain + Remediate |
collapsed_by_business_context |
Reduced to nil by deployed: false or an unreachable vector |
work_items / actionable_work_items |
Distinct (asset, package) — the unit an engineer works in |
deduplication_pct |
Scanner duplication removed, off the row count |
analysis_reduction_pct |
Severity queue removed by the exposure model |
effort_reduction_pct |
Upgrades versus findings |
It appears in the console after the table, in --format json and --format markdown under
summary.reduction, as a funnel chart on the dashboard, and in the workbook's Method sheet.
vulnometry.assessment.reduction_funnel(assessments) returns it directly if you are using the
library.
vulnometry import export.xlsx --dashboard exposure.html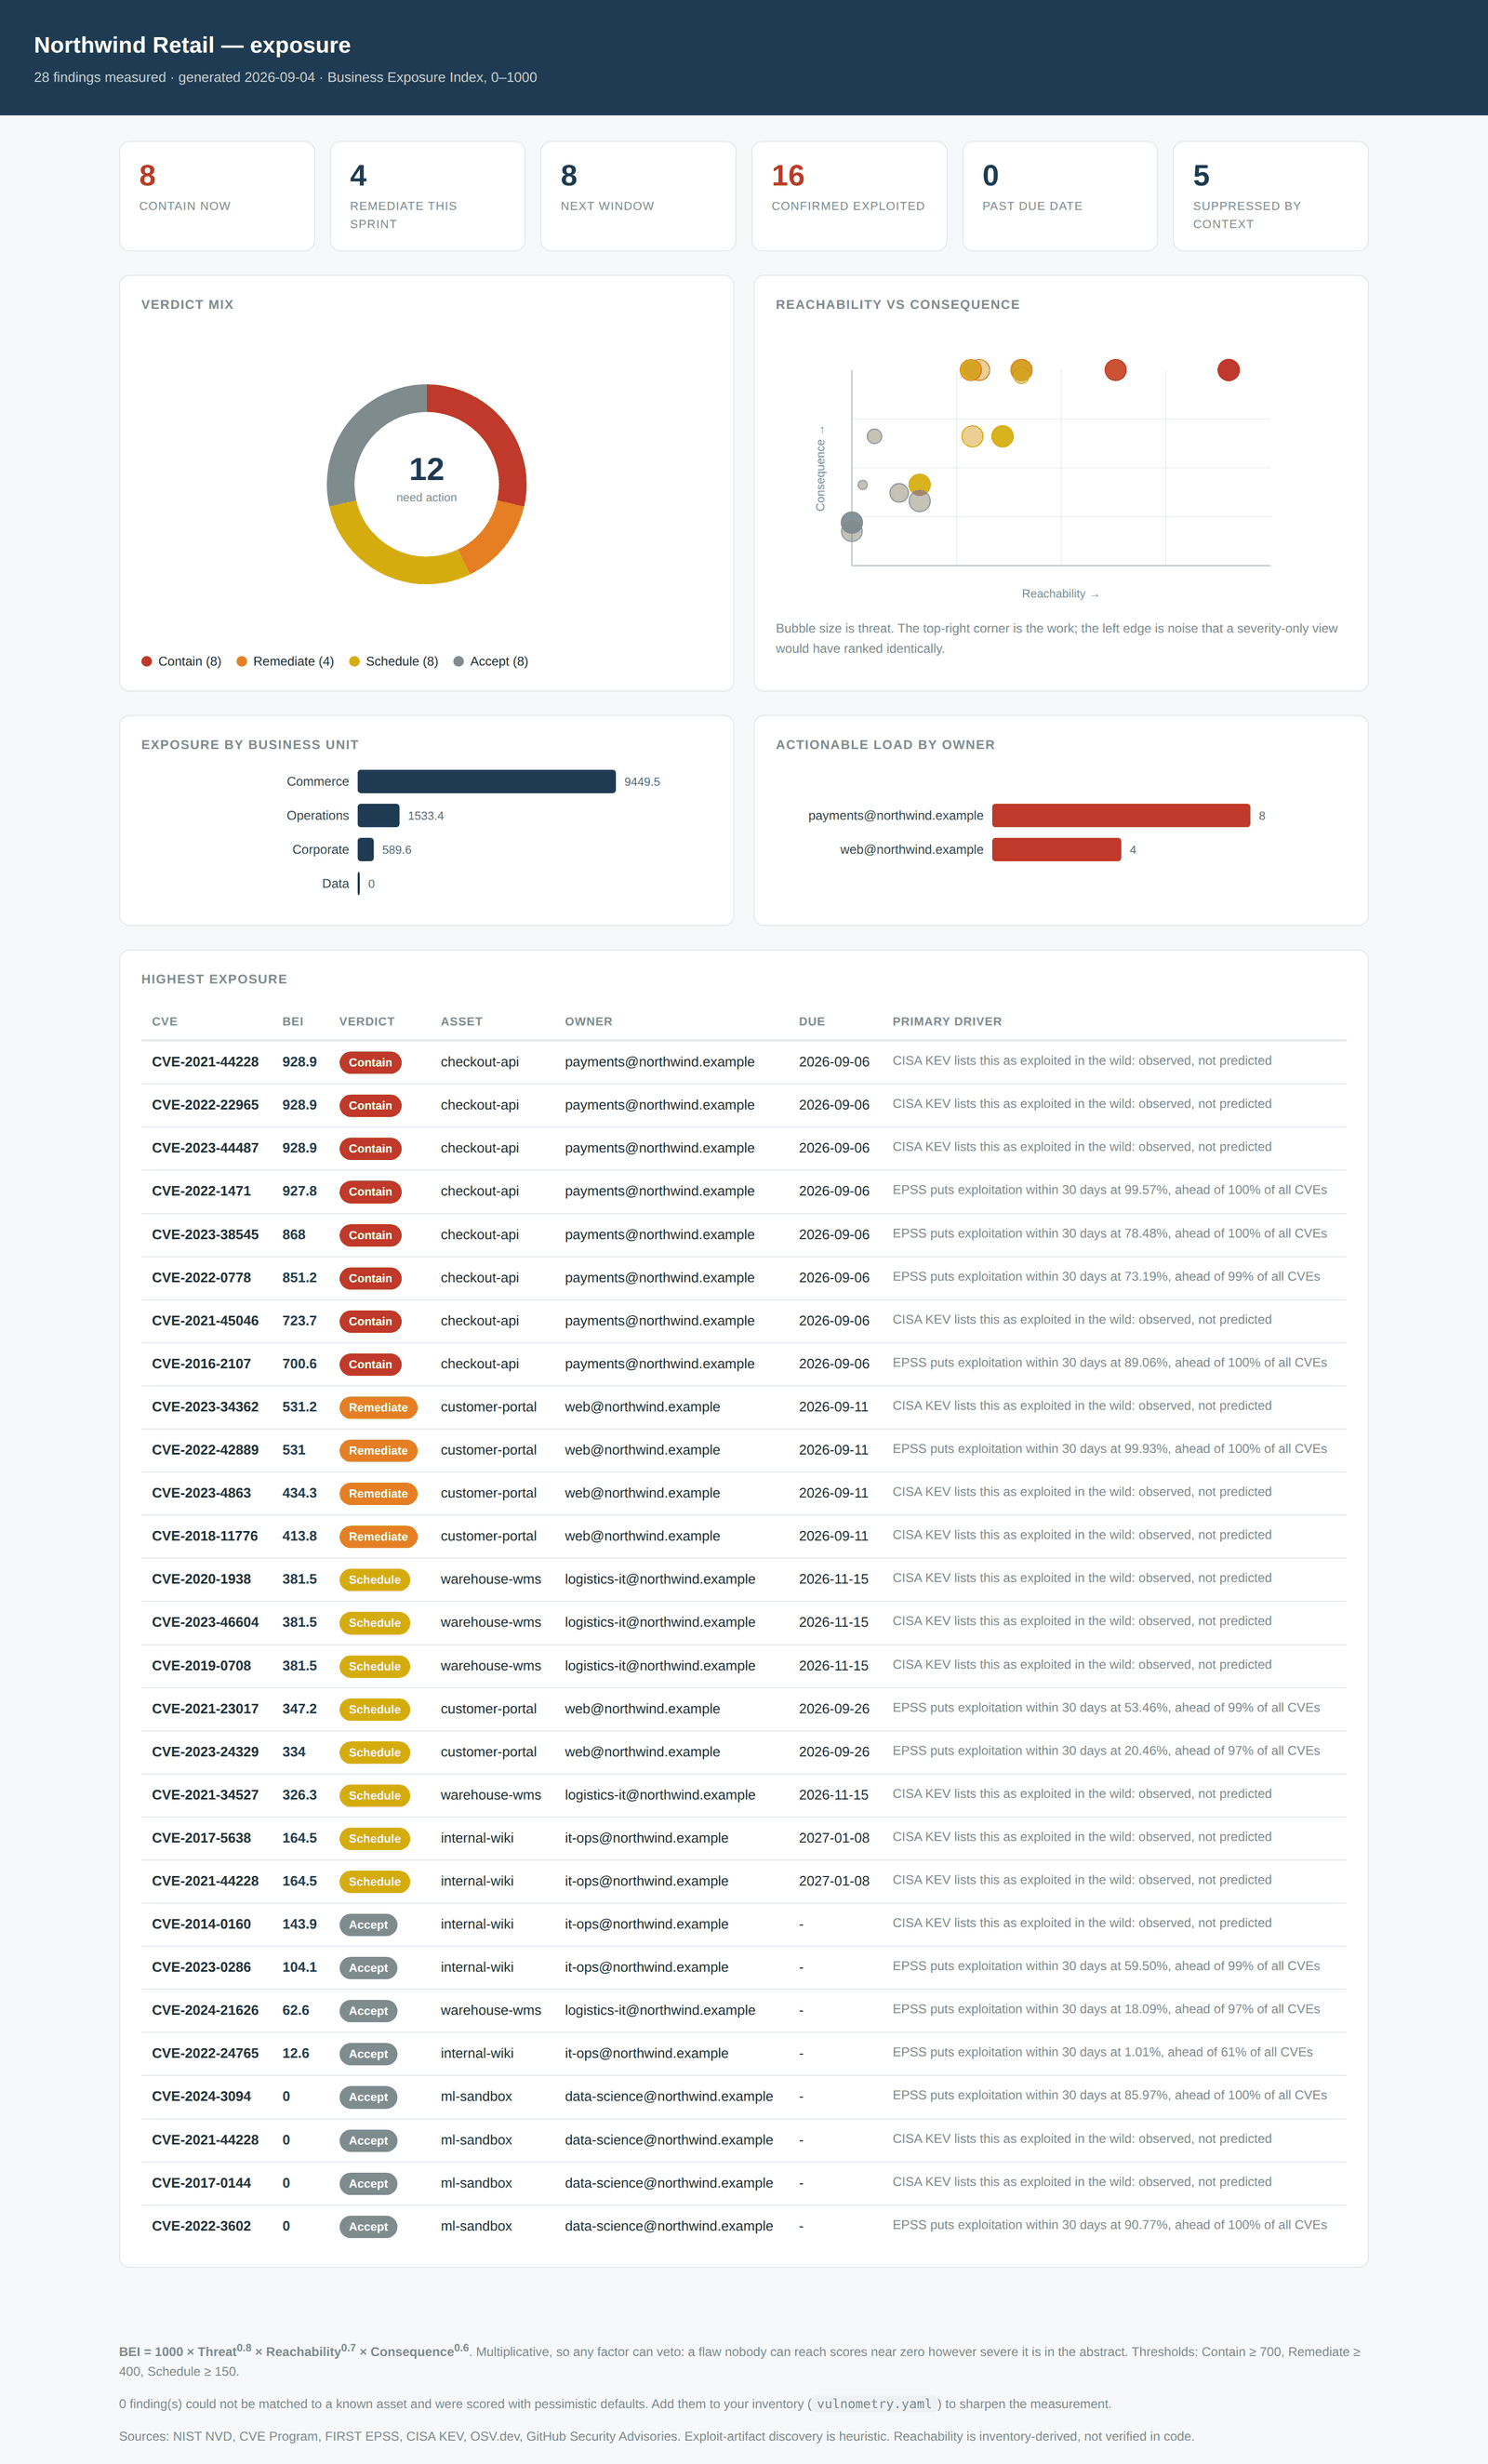
Click through for the full page, including the three-way severity rankings and the heat map. The file itself is
examples/exposure.html — download it and open it in a browser
for the hover detail on every bubble.
One self-contained HTML file. No server, no CDN, no build step and no JavaScript framework;
charts are inline SVG generated in Python. It opens from file:// and works air-gapped, which
matters when the person who needs the summary is not the person with a terminal.
Two KPI rows. The first is the four verdicts — contain now, remediate this sprint, schedule, accept — plus confirmed-exploited and past-due counts, each with a one-line subtitle so a reader who has never seen the tool knows what the word means. The second is the leadership view: what percentage of the severity queue the analysis removed, how many upgrades that leaves, the analyst hours that were never spent, and how much of the scan matched no asset.
Where the work sits. A heat map of business unit (or owner, or asset — whichever your inventory populates) against verdict. Colour is the verdict, depth is the count, and rows are ordered by total exposure, so the top row is where attention buys the most. A row that is wide on the right and empty on the left is carrying volume, not risk.
What the analysis removed. The funnel described above, as a bar chart.
The same findings, ranked three ways. "You accepted 40 Critical findings" is the first challenge any report of this kind meets, so the page answers it rather than leaving it to be discovered. One row for what the scanner called Critical and High, one for what NVD's CVSS calls them, one for the verdict this tool reached. The first two disagree routinely, because a scanner's own rating is not CVSS; neither is a verdict. Anything rated below High totals under "other" rather than being dropped, so the rows reconcile against the finding count.
The first row is labelled with the tool that produced the export. sniff_tabular_scanner()
recognises Snyk, Tenable Nessus, Qualys, Rapid7 InsightVM, Wiz, Prisma Cloud, Trivy and
Dependabot by columns only that tool emits, so a Snyk export reads Snyk and a Qualys export
reads Qualys. Every signature needs two distinctive columns, so a stray Plugin ID in a
hand-made spreadsheet cannot make the report claim the data came from Nessus. The generic
export in the screenshot above identifies no tool, so it reads Scanner. Nothing in the model
branches on the name; it is a label.
The same numbers are on summary.severity_crosstab in the JSON output, split by
by_scanner_severity and by_cvss_band.
Then a verdict donut, exposure by business unit, actionable load by owner, and a reachability-versus-consequence scatter with bubble size set by threat. Findings in the top-right corner are the ones to work on; the cluster on the left edge is what a severity-only view would have ranked identically.
The hours KPI is an assumption, not a measurement, and the dashboard says so on the face of the card:
findings_not_triaged x triage_minutes / 60
findings_not_triaged is the severity queue less what the model says to act on. Triaging one
finding by hand — read the CVE, work out where it runs, judge whether it matters here, write it
up or close it — takes anywhere from half an hour to two, so the result is reported as a band
rather than a false-precision single number, with the per-finding assumption printed beside it.
Set your own with VULNOMETRY_TRIAGE_MINUTES_LOW and VULNOMETRY_TRIAGE_MINUTES_HIGH. It never
feeds a score.
That example is real output, not a mock-up. Reproduce it in one command:
vulnometry import examples/scan-export.csv --inventory examples/vulnometry.yaml \
  --lens full --dashboard exposure.html --title "Northwind Retail exposure"
Also served at /dashboard when running vulnometry serve http.
| Command | What it does |
|---|---|
vulnometry measure CVE-... |
Measure one or more CVEs, with full reasoning |
vulnometry compare CVE-... |
The same CVE against every asset in your inventory |
vulnometry import FILE |
Bulk-measure a scanner export or SARIF/JSON report |
vulnometry sweep FILE |
Check a dependency manifest or SBOM |
vulnometry watch --days 7 |
Newly confirmed exploitation from CISA KEV |
vulnometry inventory init |
Write a commented inventory template |
vulnometry inventory import FILE --map M |
Build the inventory from an asset export via a column mapping |
vulnometry doctor |
Check feeds, keys, inventory coverage and providers |
vulnometry ask "..." |
Ask a model, with the actions attached |
vulnometry serve mcp |
Run as an MCP server |
vulnometry serve http |
Run as a REST service |
vulnometry cache |
Inspect or clear the feed cache |
measure and import take a --lens controlling how much evidence to gather:
signal(default) uses the CVE record, EPSS and KEV. Fast enough for thousands of rows.fulladds OSV and GHSA, so the answer includes a fix version.forensicadds a search for public exploit code.
Both also take --fail-on contain|remediate|schedule, which exits non-zero when anything
reaches that verdict. That is the hook for CI; see examples/ci-workflow.yml.
Run vulnometry <command> --help for the full set of options.
The deterministic path never calls a model, so measure, import and compare work on an
air-gapped laptop with no inference stack installed. A model is only ever used to explain a
verdict, never to produce one.
When you do want narration, one action registry feeds every provider:
vulnometry ask "what must ship before Friday?" --model ollama:qwen3
vulnometry ask "..." --model openai:gpt-4o-mini
vulnometry ask "..." --model anthropic:claude-sonnet-4-6
vulnometry ask "..." --model bedrock:us.anthropic.claude-sonnet-4-20250514-v1:0
vulnometry ask "..." --model azure:my-gpt4o-deployment       # Foundry and Azure OpenAI
vulnometry ask "..." --model onprem:Qwen2.5-72B-Instruct     # vLLM, llama.cpp, LM Studio, TGI
vulnometry ask "..." --model gemini:gemini-2.0-flash

vulnometry providers            # what is configured
vulnometry providers --probe # what actually answersvulnometry serve mcp # Claude Desktop, Claude Code, Cursor, Zed, Cline, Goose
vulnometry serve http # REST + /openapi.json for Codex, custom GPTs, n8n
vulnometry actions --dialect openai # schemas for your own agent loopAs a library:
from vulnometry import assess_finding
from vulnometry.inventory import AssetProfile

result = await assess_finding("CVE-2021-44228",
    asset=AssetProfile(name="checkout-api", tier=1, internet_exposed=True))
print(result.exposure.verdict, result.exposure.index, result.due_by)
See examples/ for working scripts, including
bring_your_own_agent.py if you already have an agent
loop and just want the schemas.
Triage tooling that dies when one upstream is down fails at the moment you need it most.
- Feeds are fetched concurrently and failures are isolated. A dead NVD costs you CVSS, not the report.
- NVD falls back to the CVE Program CNA record automatically, and records which one it used.
- Rate limits are enforced client-side with per-host token buckets, so you throttle yourself instead of collecting 429s.
- Responses cache to SQLite. The KEV catalogue is one 2 MB document and a 4,000-row import fetches it once. Without the cache, bulk analysis is not practical at polite request rates.
- Action errors come back as data rather than exceptions.
- Missing evidence lowers
confidenceand is listed ingapsinstead of being rounded away.
If your employer inspects TLS, verification goes through the operating system's trust store
rather than certifi, so the proxy's private root is found the same way curl finds it. Nothing
to configure. To override:
export SSL_CERT_FILE=/path/to/bundle.pem   # use a specific bundle instead
export VULNOMETRY_SYSTEM_TRUST=0           # or go back to certifi
A certificate that cannot be verified fails immediately rather than after four retries, and says
what to check. Note that Python 3.13 enables VERIFY_X509_STRICT, which rejects a CA certificate
whose basicConstraints is not marked critical. Enterprise roots do that often enough to matter,
and it produces Basic Constraints of CA cert not marked critical rather than anything about
proxies, which is why asking the OS is the reliable answer.
Worth knowing before you rely on it:
- Reachability is inventory-derived. Nothing here verifies that the vulnerable code path is actually invoked in your deployment; that is what commercial reachability analysis does.
- Exploit-artifact discovery is a heuristic GitHub search. A match means public code claims to exploit the CVE, not that it works.
- EPSS is a daily prediction. A missing score usually means the CVE is very new, not that it is safe.
- The tier, data-class and regime weights are defensible defaults, not empirical constants. Read the Method sheet and edit them to match your organisation.
- Unknown context is treated as uncertainty rather than safety, so vulnometry will over-score an asset you have not described. That is deliberate.
Combining NVD, EPSS and KEV for prioritisation is well-trodden ground: CVE_Prioritizer, OSV-Scanner, Grype and several MCP servers all work this territory. What is different here is the business inventory as a first-class scoring input, the multiplicative model that lets context veto, and the bulk spreadsheet workflow that most security teams actually live in.
Scoring disputes are the most useful issues this project gets; the weights are reasoned defaults, not empirical constants. See CONTRIBUTING.md for setup and the two rules that keep the codebase in shape.
Security issues: please use private vulnerability reporting rather than a public issue. See SECURITY.md.
PolyForm Noncommercial License 1.0.0. See LICENSE and NOTICE.