Repository navigation
Tutorials Index
Welcome to Wordflow. This Help guide provides written instructions for the interface and each analysis feature. Open it at any time from Help in the sidebar or jump directly to a section with a ? icon.
Wordflow offers an interface that prioritises ease of use and efficient navigation. The main user interface includes the following main sections, systematically presented in three primary columns.
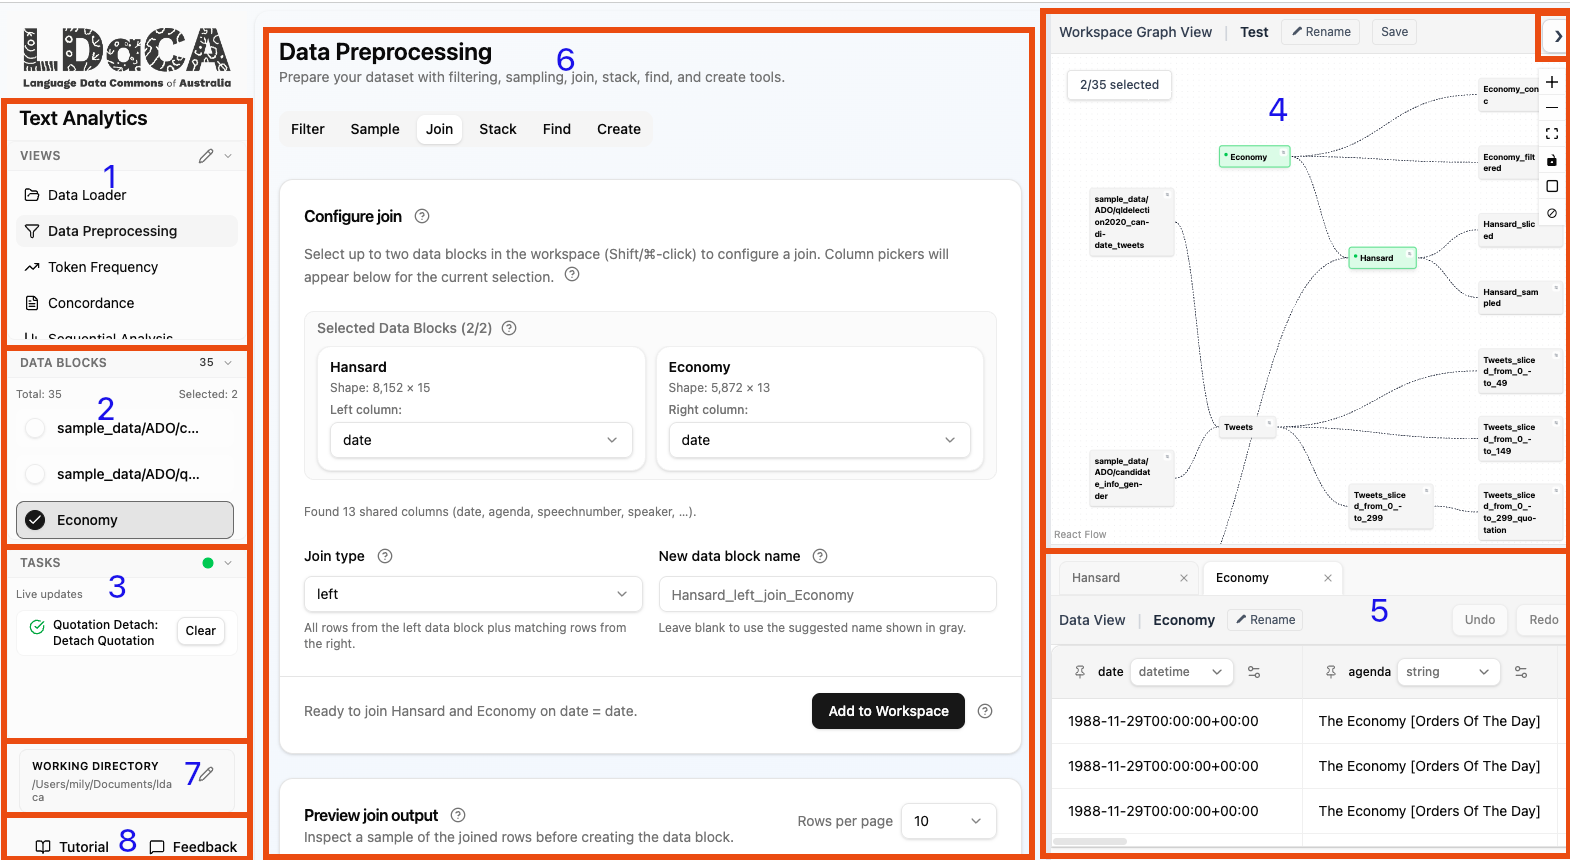
- Views: Choose and customise which tool to use.
- Data Blocks: Select the Data Block to analyse.
- Tasks: Show the progress of longer tasks.
- Project Graph: Manage all processible and produced Data Blocks.
- Data Editor: View and edit the selected Data Block(s) as a table.
- Tool Interface: The main interface of the selected analytic tool.
- Data folder: where Wordflow keeps your Projects and files.
- Appearance: Switch between the light and dark themes.
- Help and Feedback: When you encounter problems.
For detailed explanation of how each of the above sections work, please refer to User Interface Overview.
Wordflow's analyses are designed to work together seamlessly, allowing you to conduct comprehensive text analyses. Here’s how the components interact:
- Data Block: Tabular data consists of at least one column of analysable textual contents. Each row represents a unit of text (document, post, comment, speech etc.) and its associated metadata in columns. A Data Block can be viewed as a collection of texts with various types of metadata.
- Project: A set of Data Blocks that can be processed, analysed and derived from each other. The Project is a virtual space where the user uploads, processes and manipulates all relevant Data Blocks to a project or task. The Project is visualised as a graph of interconnecting Data Blocks, where the links indicates how new Data Blocks are derived from their parent Data Blocks through various operations. The user can select, rename, clone, export, or delete the Data Blocks in the Project Graph.
The Data Block is the fundamental analytic unit across Wordflow, serves as both input and output so that the result of one analysis can be processed by any other seamlessly. The text corpus and metadata can be uploaded to Wordflow then loaded as a Data Block to an active Project. Data Builder tools (such as filtering, grouping, joining, sampling, and stacking) create new Data Blocks in the Project and leave their sources unchanged, while the Data Editor adds or changes columns of a Data Block in place. The main steps are:
- Data Loader: Upload your text files and load the text corpus (e.g., interview transcripts, articles) into a Project.
- Data Editor and Data Builder: Clean and add columns in place with the Data Editor, and make new Data Blocks (filter, group, join, segment, aggregate, sample, deduplicate, stack) with the Data Builder.
- Analysis Modules: Select from available tools (such as frequency analysis, quotation extraction, topic modelling, or concordance analysis) to process your data.
- Results Integration: Combine the findings from different modules to gain holistic insights, e.g., linking topics to historical trends.
- Export & Share: Export your results in various formats (CSV or Excel tables, chart images, or a whole Project as a ZIP archive) and share them with your collaborators.
- Click a ? icon next to a control to jump straight to its explanation.
- Help will scroll to that section and briefly highlight it.
- If a help link is missing, you will see a toast and Help will stay closed.
- Create or open a Project so your work is saved together.
- Upload files or import sample data to explore quickly.
- Clean, reshape, and join your data if needed, with the Data Editor and the Data Builder.
- Run analyses like frequency, concordance, or topic modelling.
- Export results for sharing or downstream work.
- User Interface Overview: learn what each section of the main screen does.
- Data Loader: create Projects and upload data.
- Data Builder: make new Data Blocks by filtering, grouping, joining, segmenting, aggregating, sampling, deduplicating, and stacking.
- Frequency: count and explore common terms.
- Concordance: inspect terms in context.
- Topic Modelling: discover themes with native semantic clustering.
- Trends: count documents over time or along an ordered number.
- Quotation extraction: capture quoted segments with context.
- Annotation: label text manually or with a configured AI provider.
- Export: download tables or reports.
Q: What is a Project?
A Project is a saved container for your Data Blocks, settings, and analysis outputs. Think of it as a project folder inside the app.
Q: Why are there separate Help pages?
Each page focuses on a single area so you can learn in small steps and jump directly from a help icon.