Repository navigation
Tutorials Ui
The LDaCA app interface is organised into three columns. This page describes its nine main parts and how they work together.
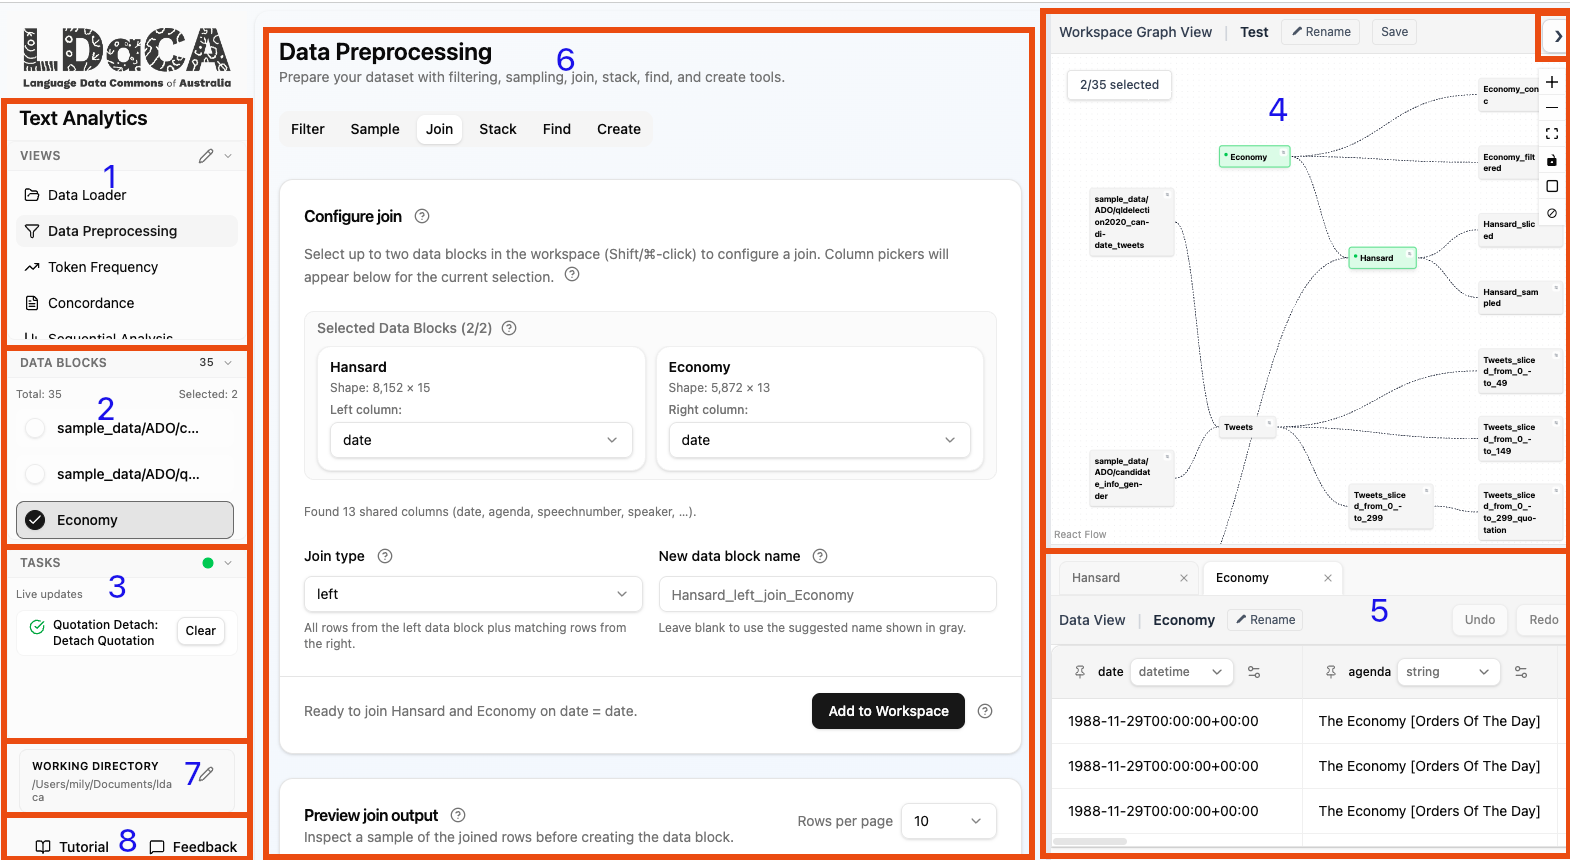
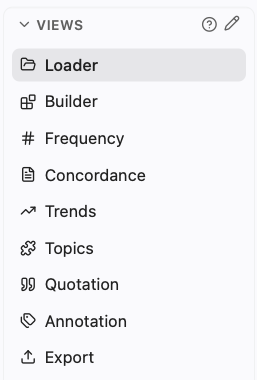
The left sidebar lists the available tool modules. Click a tool name to switch the main area (section 6) to that tool's interface. The available tools include:
- Data Loader: create or open Projects and upload data files.
- Data Builder: make new Data Blocks by filtering, grouping, joining, segmenting, aggregating, sampling, deduplicating, and stacking.
- Frequency: count and explore the most common terms, and compare two corpora.
- Concordance: inspect search terms in their surrounding context.
- Trends: count documents over time or any ordered numeric axis.
- Topic Modelling: discover themes with native semantic clustering.
- Quotation: capture quoted speech with speaker and verb annotations.
- Annotation: label text manually or with a configured AI provider.
- Export: download selected Data Blocks or a Project archive.
To save space, the sidebar shows three of these with shorter names: Loader (Data Loader), Builder (Data Builder), and Topics (Topic Modelling). The tools themselves, and Help, use the full names.
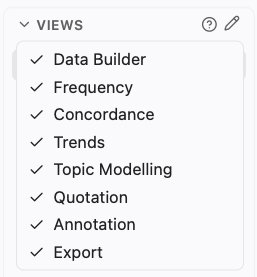
The pencil icon next to the heading (Edit visible views) opens a list of the tools with a tick beside each one. Untick a tool to hide it from the sidebar, and tick it again to bring it back. The Data Loader is always shown.
When Wordflow starts, the Views list is as tall as its entries, and it grows or shrinks when you show or hide a view with the pencil button beside the heading. Drag the line below it to choose a height yourself; that height then stays until Wordflow is started again. In a short window the list keeps the space the other sections need and scrolls.
Below the tool list, the Data Blocks panel shows every Data Block in the active Project. It is both a quick selector and a live indicator of what is selected in the Project Graph (section 4): selecting a Data Block here is equivalent to clicking the corresponding node in the graph, and the two panels always stay in sync. It is especially useful when the right column is hidden.
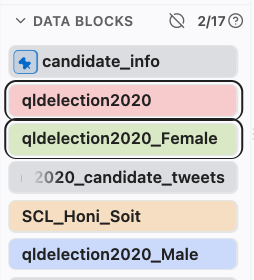
- The heading shows how many Data Blocks are selected out of the total, for example 2/12 (only the total when nothing is selected). The Clear selection button beside it (a crossed-out circle) deselects them all.
- Click a Data Block to toggle its selection. Click again to deselect it. Click several Data Blocks in turn to build up a multi-selection.
- Each Data Block is filled with its own colour, the same colour it has in the Project Graph and in charts. A selected Data Block has a dark outline around it, and a pinned one shows a blue pin at its start.
- Pinned Data Blocks are listed first, then selected Data Blocks, then the others.
- When a name is too long for the panel, its end stays visible and its start fades out; rest the pointer on it to read the full name. You can also drag the right edge of the sidebar to make it wider.
- Selected Data Blocks open as tabs in the Data Editor (section 5).
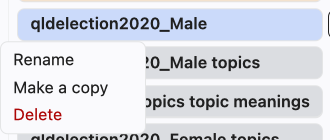
- Hover a Data Block to show its buttons: the pin, More options (the sliders icon, with Rename, Make a copy, and Delete), and +. The pin keeps it at the top of this list; click it again to unpin. In the Project Graph, hovering a Data Block shows More options and + below it. The + button (Add to tool) adds it to the inputs of the tool you are using. When the tool has one inputs panel, the Data Block is added straight away; when it has several (for example Annotation's Annotation, Codebook, and Example Data Blocks), the Data Block follows the pointer until you click the panel you want (press Esc or right-click to cancel). You can also use Add Data Block in the tool's inputs panel.
- Most tools can only process a limited number of Data Blocks at a time, shown in their inputs panel.
The Tasks panel sits below data selection and projects background Analyses from the active Project together with your retained User File Imports.
- Each analysis task is named after its tab and always starts with the tool's letter: F-1, or TM - JP vs AUS for a tab you renamed "JP vs AUS" (a Concordance opened from a word in Frequency reads, for example, C - yeah). The name follows the tab when you rename it. New tabs are named with the tool's letter and a number: F-1 for Frequency, C-1 for Concordance, T-1 for Trends, TM-1 for Topic Modelling, Q-1 for Quotation and A-1 for Annotation. Numbering continues from the highest number used.
- File imports start with L for the Data Loader, for example L - Sample data import.
- The finished steps of one tab share a row: click the row to see each step (Preview, Run, or Add to Project), the Data Blocks it used, and when it finished. A step that failed or is still running has its own row, for example C-2 · Run.
- A Run with two Data Blocks runs each Data Block separately but shows as one task: open it to see how each Data Block went, including the reason if one of them failed.
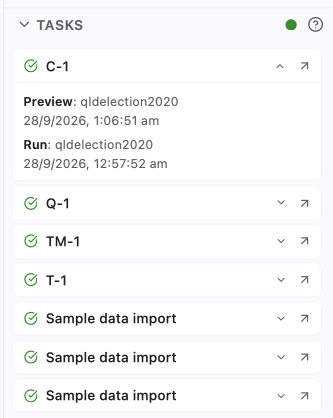
- Failed and cancelled tasks are listed first, then running ones, then finished ones.
- The arrow button at the right end of a row opens that task's tab. For a file import it opens the Data Loader; once the import has finished, it opens the folder the files went to, and the row's details say what was imported, for example "Imported 12 files (48 MB) to sample_data/ADO/reddit". Clicking anywhere else on the row shows or hides its details.
- When a name is too long for the panel, its beginning and end stay visible and the middle fades out; rest the pointer on it to read the full name.
- Analysis rows show progress and status only. Use the Analysis's owning Tab to cancel, clear, or re-run it.
- Queued and running User File Imports show Stop. The row remains visible if cancellation fails so you can try again.
- A successful import or upload leaves the panel on its own 10 minutes after it finishes; it dims in its last minute. Failed and cancelled ones stay until you click Clear in their details, so you don't miss an error.
- The brush button beside the Tasks heading clears every finished import and upload at once; running ones stay.
- Finished imports are also cleared when a session ends: when you start the
desktop app (or
pip/Binder Wordflow) again, and when you sign out of a shared server. A shared server also clears any older than a week. - Clearing a task removes only its record in Tasks, never the files it imported.
- The panel refreshes automatically, so you can keep working while tasks run in the background. The green dot beside the Tasks heading shows it is connected for these live updates; if the connection drops, a message and a Retry button appear instead.
- To give the Tasks panel more room, collapse Views or Data Blocks by clicking their headings, or drag the line between the sections.
Note: The entire right column (Project Graph and Data Editor) can be collapsed to save screen space. Click the top-right arrow button to hide or show the right pane.
The Project Graph occupies the top-right area and visualises Data Block creation lineage. Every Data Block is a node, and creating a child Data Block (made from another) draws an edge from parent to child. Updating an existing Data Block does not change the graph.
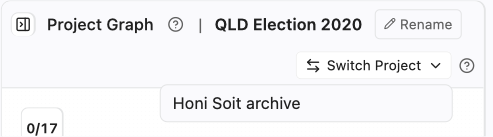
To switch Projects without going to the Data Loader, use Switch Project at the right end of the Project Graph title bar and choose another Project. Wordflow asks you to confirm, then closes the current Project (it is saved automatically as you work) and opens the one you chose. While a task is still running in the current Project, the Projects in the list are disabled and a note says so: wait for the task to finish, or stop it in its tab, and then switch.
- Click a node to select that Data Block across the entire interface. Click it again to deselect. Selections made here are reflected immediately in the Data Blocks panel (section 2) and vice versa.
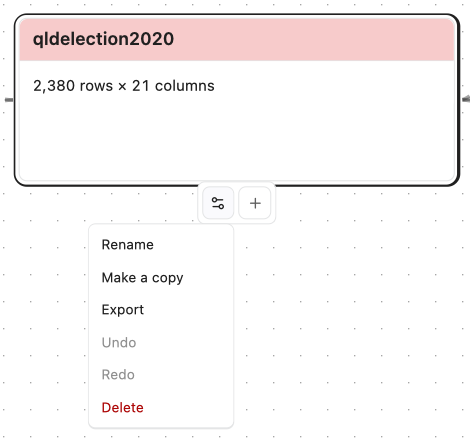
- Each Data Block shows its name. When you zoom in far enough, it also shows its size, for example 2,380 rows × 21 columns.
- Hover a Data Block and open its settings menu (the sliders icon below it) to Rename, Make a copy, Export, Undo, Redo, or Delete it. The + beside it adds the Data Block to the inputs of the tool you are using.
- More of the graph is visible when you make the right column wider (drag its left edge) or give the graph more height (drag the line between the graph and the Data Editor). A copy is named after the original with
_copyadded (for examplespeeches_copy). Undo and Redo availability comes from that Data Block's current backend session history. - Use Rename beside the Project name in the title bar to rename the active Project.
- To move around a large Project, drag anywhere on the graph, also over a Data Block, or scroll with two fingers on a trackpad (or with the mouse wheel). Data Blocks stay where the layout places them; they cannot be dragged. To zoom, pinch on a trackpad, or hold Ctrl (⌘ on a Mac) while scrolling.
- To select several Data Blocks at once, hold Shift and drag a box around them, or switch the panel's drag button to Drag to select and drag without Shift. Every Data Block the box touches is added to the selection, as if you had clicked it. In Drag to select mode, drag with the right mouse button to move the graph.
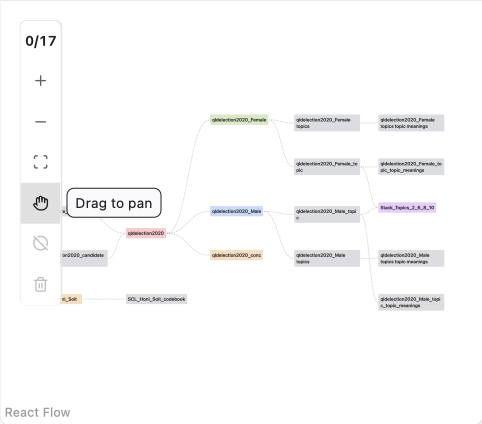
- A vertical control panel sits at the top-left corner of the graph. At the top it shows the selected/total Data Block count (for example, 0/2). The panel stays narrow so it does not get in the way; rest the pointer on a button for half a second to see its name.
The panel provides the following actions:
- Zoom in: increases the zoom level.
- Zoom out: decreases the zoom level.
- Fit view: shows the whole graph if its Data Block names can still be read. A large graph is shown from its first Data Blocks instead; scroll to see the rest. When zoomed out, Data Blocks show only their names and sit closer together.
- Drag to pan / Drag to select: chooses what dragging an empty part of the graph does. Drag to pan (the default, a hand icon) moves the graph; Drag to select (a dashed box) draws a selection box. Click the button to switch.
- ⊘ Clear selection: deselects all currently selected Data Blocks at once. Greyed out when nothing is selected.
- Delete (n): asks for confirmation, then deletes the selected Data Blocks. The confirmation lists them with a tick each: untick any you selected by mistake to keep them (they stay selected), then click Delete. Analysis tabs that use a deleted Data Block close too, with their results; Data Blocks made from it stay. Greyed out when nothing is selected.
- Selected Data Blocks are outlined.
The Data Editor fills the bottom-right area. It shows the contents of the selected Data Blocks as a table, and it is where you change a Data Block in place: its columns and their values. Tools that make new Data Blocks or change which rows are present (Filter, Group, Join, Segment, Aggregate, Sample, Deduplicate, Stack) are in the Data Builder.
- Each selected Data Block has a tab in the Data Editor title bar. Click a tab to show that Data Block; the × on a tab deselects it, and you can drag tabs to reorder them. When the tabs do not fit, scroll the strip or use the arrow buttons at its ends.
- To give the table the whole window, click Maximise Data Editor at the right end of the title bar, before the list of tabs. The sidebar, the analysis tool and the Project Graph are hidden; click Restore layout in the same place, or press Esc, to go back with every size you set as it was. The layout also comes back by itself when no Data Block is selected, or when you go to another tool.
- To rename a Data Block, click its tab to make it the current one, then double-click the tab name, type the new name, and press Enter (Esc cancels). Analysis tool tabs are renamed the same way.
- Every rename box (tabs, columns, the Project name, Data Blocks) works the same way. Enter saves and Esc cancels. Clicking elsewhere saves an edited name. If a rename fails, for example because the name is already used, a message explains why and the box stays open with the name selected so you can fix it. Press Enter to try again, or click elsewhere without changing it to keep the original name.
- With many tabs, click the arrow at the right end of the title bar for a list of every tab in alphabetical order, and choose one to switch to it. A very long name shows its start and end, with the middle faded.
- The download icon beside Overview saves the Data Block shown as CSV or Excel, without going through the Export view.
- Overview (beside Undo) shows the Data Block's rows and columns and a short overview of one text column: documents, empty documents, duplicate documents (identical to an earlier one), the total number of words, and the shortest, median, mean and longest document. Words are counted between spaces, without a tokeniser; text with few spaces, such as Chinese or Japanese, is counted in characters instead. The overview is read when you open it, so it always matches the current data.


-
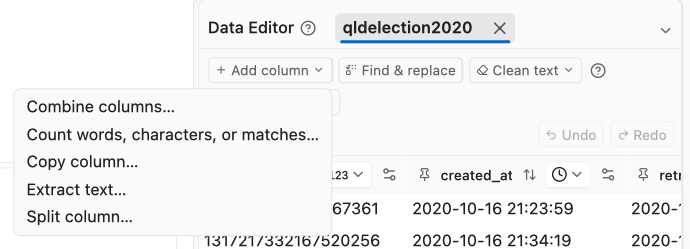
Column tools in the Data Editor header (Add column, Find & replace, Clean text) change the selected Data Block without creating a new one, and never add, remove, or reorder rows:
-
Add column: Combine columns (write a template such as
{title}: {body}: type{to pick a column from a filtered list, or use Insert column; any other text, such as separators or labels, is kept as written, and columns of any type are joined as text; choose whether a missing value counts as blank text or leaves the combined value empty. A template with no column, such asHansard, gives every row that same fixed value), Count (words, characters with or without spaces, or matches of a text or pattern, in a new column right of the source; words are runs of text between spaces or line breaks), Copy column (the copy is placed right of the original and named like a copied file, for exampletext copy, thentext copy 2), Extract text (copy the matches of a text or pattern into a new column), Map values (see below), and Split column (choose the number of columns, then type each delimiter and press Enter to add it: punctuation, a space, or several characters; tick Also split at each new line for line breaks; split from the left so the last column keeps the rest, or from the right so the first column keeps the rest). - Find & replace: replace a text, in the same column or a new one.
- Map values: make a new column by typing a new value for each value of a column, for example to group parties into sides or fix spelling variants, without regular expressions. Each value is listed with its number of rows, 50 to a page, most common first; choose A to Z, ignoring case to bring variants such as greens and Greens together. Type the new value beside each one: values you have typed are suggested in the other boxes, so several values can share one group. A blank box leaves the cell empty, and a warning says how many rows will be empty. Fill the rest copies the original value into every blank box, so you need only type the changes. At most the 500 most common values are listed; a note says how many more there are, and whether they keep their value or become empty. Empty cells have their own (empty) row. Numbers and dates are listed and matched as shown, and the new column is text.
- When a tool can write to A new column, right of it, the new column gets a suggested name (for example
text replaced,text cleaned, ortext matches) so the preview appears straight away. Press Tab to accept the grey suggestion and edit it, or type your own name. - Find & replace, Extract text, and Count match plain text as written. Tick Use regular expression to match a pattern instead; for example, a plain
.finds only dots, while the regular expression.matches any character. See Regular expressions for what a pattern is, with examples. -
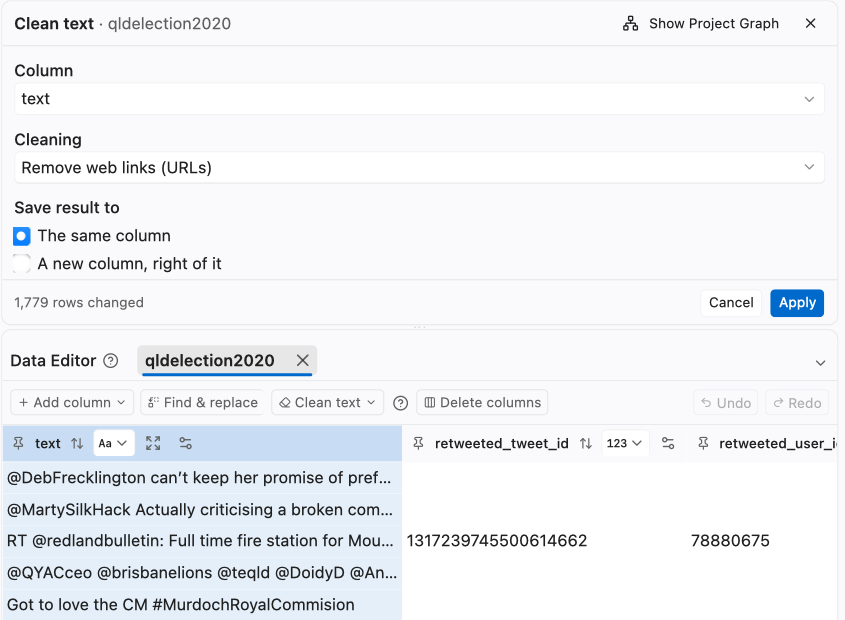
Clean text: trim spaces, collapse repeated spaces, change case (lowercase, UPPERCASE, Title Case), or remove punctuation, digits, web links, HTML tags, or XML tags and markup (declarations, comments, and CDATA wrappers too, with
&-style entities decoded), in the same column or a new one. - The same tools are in each column's settings menu, with that column already chosen.
- Column names are used exactly as written, including any spaces at the start or end (for example, a CSV header
ID, textnames the second columntext). - Column choices in every tool can be filtered by typing, so long column lists never need scrolling.
-
Add column: Combine columns (write a template such as
- A tool opens in a panel above the table, in place of the Project Graph (use Show Project Graph to look at the graph, and Back to tool to return; Close, or the ×, closes the tool). While the Data Editor is maximised, the tool opens above the table in the same way, with no Show Project Graph, and the line between them resizes as usual. While you set it up, the table previews the result with the affected columns highlighted, and the panel reports how many rows change across the whole Data Block. The table scrolls so the column you are editing sits at the left edge, with any new column beside it; for Combine columns, whose new column is added at the end, it scrolls to the end. Scrolling or clicking in the table yourself stops this for the current preview. Apply makes the change as one step, so Undo reverses it. When Find & replace or Clean text saves its result to the same column of a category, number or date column, that column becomes a text column; the panel says so before you apply, and Undo restores the column's type and values together. The tool stays open on the same column with fresh settings, so you can make the next change straight away, on that column or another. Cancel discards settings you have not applied.
- If you select another Data Block while a tool has unfinished settings, Wordflow asks whether to Keep editing or Discard them.
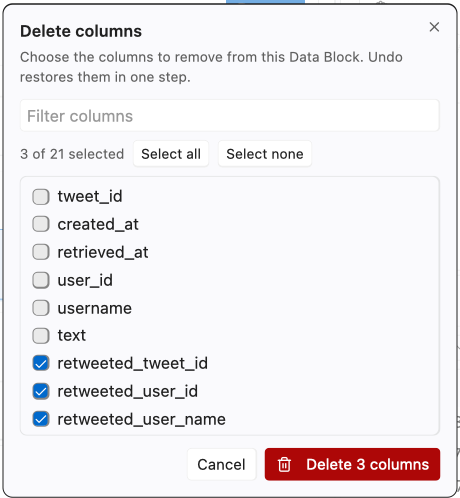
- Delete columns opens a list of the Data Block's columns, each followed by its first value as an example ((empty) when the column has none): tick the ones to remove (filter, Select all, Select none), then confirm. They are removed in one step, so a single Undo brings them all back. At least one column must remain.
-
Undo and Redo, at the right end of the tools row, revert or reapply the selected Data Block's most recent plan edit. The same actions are available in the graph Data Block menu. History is independent per Data Block, stores at most 50 plans, and lasts only while the Project remains open in the backend process. Closing and reopening preserves the latest data but clears both buttons.
-
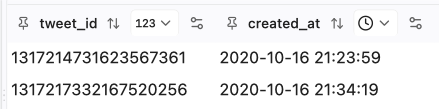
Each column header shows the column name and a symbol for its data type, which keeps columns narrow. Point to the symbol to see the type's name (and, for an unusual type, how it is stored):
Symbol Data type AaText tag Category 123Whole number 1.2Decimal calendar Date (a calendar date with no time of day, useful for publication or sitting dates) clock Date and time timer Elapsed time (time into a recording, such as a transcript's 7:58.5)tick box True / false list List (of text, or of other values) pie chart Topic coverage Use the pin button to keep a column at the left edge, click the sort button (the up and down arrows) to sort the table by that column (empty cells stay at the bottom either way), and expand or collapse a wide column. Any column whose values are too long for about 45 characters, a text column or a metadata column such as a file address, is shown at a limited width with its values cut short; the expand button in its header shows more, and resting the pointer on a cell shows the whole value. These operations update the selected Data Block without creating a new one.
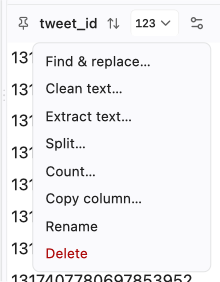
- Click the settings icon (the sliders) at the right of a column header for that column's tools (Find & replace, Clean text, Extract text, Split, Count, Copy column) and to Rename or Delete it. You can also double-click a column name to rename it: type the new name and press Enter (Esc cancels).
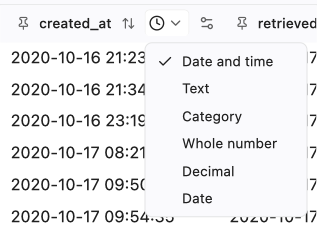
- Click the data type symbol to convert the column to another type. The menu lists the types by name, with the current type ticked.
- Choosing Category opens a window that lists the column's values in order. That order is used wherever the values appear: table sorting, Filter's value list, Group, the Trends axis and groups, and the Topic Map colour legend. Text starts A to Z (numbers inside the values count as numbers, so Q9 comes before Q10); numbers and dates start Smallest first. You can also choose Z to A or Largest first, or Most rows first and Fewest rows first, which use the row count shown beside each value. To make your own order, drag the values (or focus a value, press Space, move it with the arrow keys, and press Space again). Empty values are not a category: they are always last. Text that is empty or only spaces becomes empty. A column with more than 150 different values asks before listing them, because the list will be long to arrange; you can continue or cancel. For a long column, or the Data Block's document column, Wordflow first reads the first 10,000 rows and asks before reading the rest, so choosing Category on a text column by mistake costs nothing. The window lists at most 300 values: with more, it says how many are not shown, the order buttons still order every value, and the values not shown follow in that order (only the listed ones can be dragged). Such a column is usually better kept as text. The limit is 10,000 different values. To change the order later, choose Category again on a category column.
-
A topic coverage column (
TOPIC_coverage, added by Topic Modelling's Add to Project) holds each row's share of every topic rather than a single value. Its Sort and data type buttons are disabled, and among the column tools its settings menu offers only Copy column (you can still rename or delete it). -
A type change never stops because of messy data: values that cannot be converted (for example a typo such as
5OOin a column changed to whole number) become empty, and a warning says how many there were and gives the row and value of the first one, so you can find and fix it. Undo restores them while the Project is open. -
Missing values, NaN, and blank text are all shown as empty cells, in the table, previews, and Row Details.
-
Converting text (or a category) to a date or a date and time, text to a number, or a date to text opens a conversion window. It says how the values are written, shows a few rows with what they become, and checks the whole column first: for example 2,380 of 2,400 values convert; 20 would become empty, with the first values that don't convert. Convert is available once the check has run; values that don't convert become empty, and Undo restores them.
-
Text to a date, or a date and time. Wordflow reads the column's first values and lists the Formats that fit, with how many values each reads and an example. It knows the common ways of writing dates, ISO dates with times and time zones, Twitter dates (
Thu Oct 01 23:59:59 +0000 2020), and email dates. To change the format, use the menus under What each part of a value is: each part of one value (30,01,2020) has a menu saying what it is (Day, Month, Year, Hour, Month name, Time zone, and so on). The Format code field below shows the same format as code (%d/%m/%Y) for anyone who prefers to type it; the full list is in Python's date format codes.- Dates such as
03/01/2020can be day first or month first. When every value reads both ways, Wordflow reads them day first and says so; Read month first switches with one click. - A date inside longer text, such as the file name
2021_01_17_SmithInterview, is found too, and the rest of the text is ignored. If Wordflow doesn't find it, name the date's parts and choose Ignore (not part of the date) for the text before or after it (a part in the middle of the date can't be ignored). Find the date inside longer text below the format code does the same for a typed format. - Two-digit years (
30/01/20) need a century, and Wordflow never guesses it: choose 1900s, 2000s, or Split at a year (with 50,00to49are 2000s and50to99are 1900s).
- Dates such as
-
Numbers to a date. A column of numbers can be Unix time (seconds, or milliseconds, microseconds or nanoseconds, since 1 January 1970) or an Excel day number (days since 30 December 1899, as Excel stores dates;
43831is 1 January 2020). Wordflow suggests the Unix unit that fits; Excel day numbers are listed but never chosen for you, because ordinary counts can look like them. -
Text or numbers to elapsed time, and back. See Elapsed time below.
-
Text to a number. Choose the Decimal mark (point or comma) and Thousands separator (comma, point, space, apostrophe, or none), and whether to Ignore currency signs, % and other symbols, so
$1,234.50becomes1234.5. With a thousands separator, the digits must be in groups of three (1,234converts;1,23does not). Converting text or decimals to a whole number rounds to the nearest whole number, with halves away from zero (2.5becomes3,-2.5becomes-3). -
A date to text. Choose how the dates are written, from examples such as
30/01/2020,30 January 2020orThursday 30 January 2020, or build your own from the parts (Day, Month name, Year, and so on). -
Elapsed time is time into a recording, such as the start of each line of a transcript. It shows as minutes and seconds,
7:58.5, or with hours from an hour on,1:23:20.25; the fraction of a second appears only when it is not zero. A spreadsheet column of times without a date (Excel keeps a cell formattedmm:ss.0as a time on 30 or 31 December 1899) loads as elapsed time, and a message says so. To make elapsed time from other columns:-
Text such as
7:58,07:58.5,1:23:20or00:07:58,542(as in subtitle files): choose Elapsed time. A time with two parts, such as7:58, is minutes and seconds unless you choose hours and minutes. -
Numbers: choose what they count: milliseconds, seconds, minutes, hours, or days (as Excel stores times, so
0.25is 6 hours). - A date and time: its time of day becomes the elapsed time.
Elapsed time can become Text (written like
7:58.542,0:07:58,07:58and so on) or a Decimal or Whole number of milliseconds, seconds, minutes or hours (7:58.5is478.5seconds; whole numbers round to the nearest). Sorting, Filter (type times like7:58), Group, Aggregate (sum, mean, smallest and largest) and Trends all work with it. Exports keep it: CSV writes it as text such as7:58.5, and Excel as a time in Excel's[h]:mm:ssformat. -
Text such as
-
Dates and times show year first, for example
2020-01-30 14:05(seconds appear only when they are not zero). Wordflow stores times in UTC. To type a date, for example in the Data Builder's Filter, useYYYY-MM-DD, orYYYY-MM-DD HH:MMfor a date and time. Charts write dates for reading instead, for example 18 Oct 2020 or Oct 2020, the same for every user. -
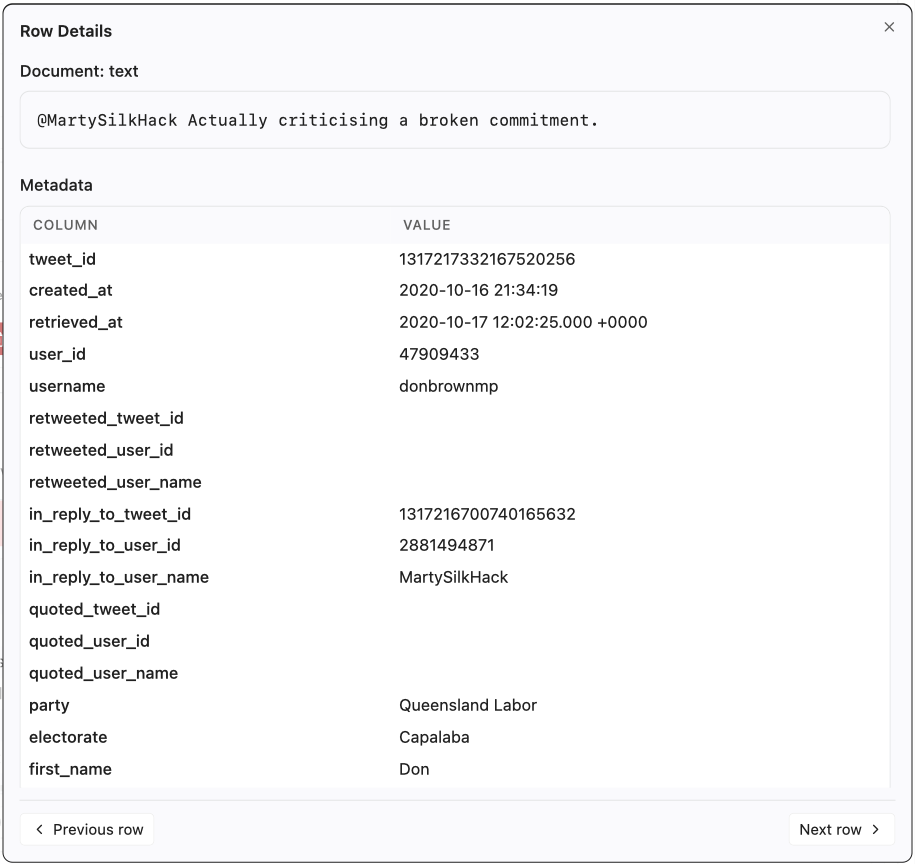
Click any row to open the Row Details panel, which displays the full contents of that row in a readable layout. The panel has two sections:
-
Document: shows the full text of the Data Block's designated document column (the column marked as the primary text when the data was loaded, e.g. the column named
text,document, ordoc). The section heading displays the column name, e.g. Document: text. If no document column has been configured for the Data Block, this section is omitted. - Metadata: shows all remaining columns as a two-column key/value table, making it easy to inspect metadata columns such as speaker, date, or source alongside the document text.
-
Document: shows the full text of the Data Block's designated document column (the column marked as the primary text when the data was loaded, e.g. the column named
-
Use Previous row and Next row at the bottom of the Row Details panel to review adjacent displayed rows. The Data Editor changes table pages automatically when you move past the first or last row on a page.
- The table is paginated: use the controls at the bottom to choose how many rows a page shows and to move between pages.

- Scroll vertically with your mouse scroll wheel. Hold Shift to scroll horizontally.
The centre column is the main working area and shows the interface of whichever tool is selected in section 1. Each tool provides its own configuration options, previews, and action buttons.
- The tool name and a short description appear at the top.
- Sub-tabs (e.g. Filter, Group, Join, and Stack in the Data Builder) let you switch between related operations within the same tool.
- Each analysis tool can hold several tabs, so you can keep several analyses side by side: + in the tab strip opens another. Tabs are on by default; to keep one tab in each tool, turn off Enable multi-tab under Settings → General (the + button's tooltip says so too). A hint at + offers Turn off tabs…, which shows the way there step by step.
- Most tools follow a common workflow: configure parameters → review a preview → create the result. Data Builder tools always create new Data Blocks and leave their sources unchanged; the Data Editor's column tools always update the selected Data Block in place without changing its rows.
- In the analysis tools (Frequency, Concordance, Trends, Topic Modelling, Quotation, Annotation), the parameters sit above the results, and each part scrolls on its own. Once there are results, drag the bar between them to give either part more height, or use the arrow keys when the bar is focused; double-click the bar to go back to the default. Each tool remembers its own setting.
- To read results on a small screen, or to concentrate on them, click Maximise results at the right end of the bar between the parameters and the results. The results take the whole window: the sidebar, the Project Graph and Data Editor, the tab strip and the parameters are hidden, and a line at the top names the tool and tab. Everything in the results works as before, including resizing each result. Click Restore layout, or press Esc, to go back: the parameters, your selections and every size you set by hand are as you left them. The layout also comes back by itself when you go to another tool or Project, or when the results are cleared. Contextual hints wait until the layout is restored, and a suggestion that points at a parameter offers Show settings, which restores the layout. Maximising is not remembered when Wordflow is reopened.
- Some tools have an Advanced switch at the top right of their parameters. Off, the tool is in its Basic mode: it shows the settings a first analysis needs and uses the defaults for the rest. Turn Advanced on to see and change the rest, listed together under Advanced settings. Turning it off again hides those settings and goes back to their defaults for the next run; what you had set is kept and returns when you turn Advanced on. A result already on screen stays as it was run. Each tab remembers its mode on this computer, and a new tab starts in the mode you last chose for that tool. Trends keeps Normalise against there.
- The main results (tables, lists, and charts) fill the space below the bar, sharing it when there are several, so the bar makes them taller or shorter. To size one result on its own, drag its bottom-right corner, as with the Stop words box; the others share the space that is left. Double-click the corner to let it fill the space again. For example, in Topic Modelling make the bubble chart shorter to give the topic lists more room. Word clouds keep their width-based height until you resize them.
- Help icons (?) are placed next to individual controls. Hover one for a short reminder of what the control does; click it to open the matching Help section with more detail. A blue i opens the About page for a tool, and a quote mark opens a reference (how to cite, or a source and its licence).
- The arrows at the top of the window go back and forward between the tools you have visited. The search box beside them (Open quick access) lists the analysis tabs of the open Project, for example Frequency: F-1: type to filter them, and choose one to open it.
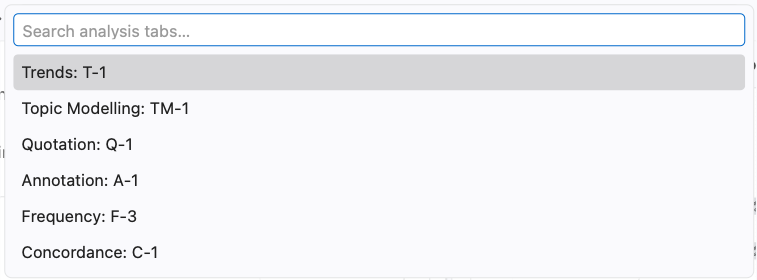
The analysis tools share three buttons.
- Preview works out a first few pages of results so you can check your settings quickly. Where a tool offers it, use Preview before a long Run.
- Run works through all of your data. Use it for the final result, for sorting on every column, for charts of the whole result, and before Add to Project.
- Clear removes this tab's Preview and Run results so you can start again. It does not remove Data Blocks you have already added to the Project, and it does not undo changes written to a Data Block (use Undo in the Data Editor for that).
What to expect:
- Results keep the data they were made from. Preview and Run each take a copy of the settings and the data at the moment you choose them. If you later edit the Data Block or change a setting, the results on screen do not change. To see the effect, choose Preview or Run again.
- The buttons turn on when something changes. After a successful Preview or Run, its button stays off until you change a setting that affects it. Changing the setting back turns it off again, because the result on screen already matches.
- Settings are locked while a task runs. Use Stop to cancel it. The running task also appears in Tasks.
- After a failure or a stop, you can edit the settings again, but Preview and Run stay off until you choose Clear. Annotation is the exception: its Preview and Run replace the tab's earlier results, so they turn on again without Clear. The message explains what went wrong; Details has the technical text for a feedback report.
- Results stay with the tab. They are still there when you move to another tool, or close and reopen the Project.
The data folder is where Wordflow keeps your Projects, imported files, and settings.
- On first start, Wordflow uses the usual location for your operating system and remembers it. There is nothing to choose.
- If that folder cannot be used (for example, Wordflow is not allowed to write to it), a setup screen says so and lets you choose another folder.
- The desktop app opens your computer's folder picker. In a browser, type the full path of a folder on the server that runs Wordflow.
- To change it later, open Settings → Project → Data folder. Wordflow reloads after the change and does not copy anything from the old folder.
- On a shared server, the data folder is set by the person who runs Wordflow, and Settings says so.
Some steps are slow, so Wordflow keeps their results and reuses them when you run a tool again on the same text. Topic Modelling keeps the text it has read into its model, and the Tokeniser keeps text already split into tokens by tokeniser models. The caches grow with every corpus you analyse and are not cleared automatically.
Settings → Project → Tool caches shows how much space each cache uses. Clear removes one cache after you confirm. Nothing in your Projects changes; the next run of that tool on the same text is slower while the cache fills again. If an analysis is using the cache, Wordflow asks you to try again when it finishes.
Open Settings (the gear icon at the top right) → General → Appearance and use the switch to change between Light 2026 and Dark 2026. The interface changes immediately and the selection is saved to your account. Wordflow uses the last successful selection during startup so a reload does not briefly show the other theme. Charts and Data Block identity colours remain stable, while downloaded chart images keep a white background.

The Help and Feedback buttons at the very bottom of the left sidebar provide quick access to assistance.
- Help opens the built-in written guides in a floating window (the one you are currently reading). Clicking any ? icon scrolls Help to the relevant section.
- Feedback opens a form where you can report bugs, request features, or ask questions. Your feedback goes directly to the developer team. Please do not include any confidential information.
- When something goes wrong, the message says what happened in plain words. Many messages also have Details: technical text that helps the developers find the problem. Use Copy details, then Send feedback, and paste the details into the form. If the same error keeps happening, please report it this way.
- In the title bar, the icons beside the Wordflow name open About Wordflow (i) and Cite Wordflow (quote mark). Select the Wordflow name to open the Wordflow website, where the desktop app can be downloaded, or the LDaCA logo to open the LDaCA website. Both open in a new tab (in the desktop app, in your web browser).

- Each of the nine functions can show brief Contextual Hints as you reach useful milestones. A hint never dims or blocks the page: it outlines what it points at (pulsing when it is a button to click), and you can keep working while it shows. Using what it points at, such as clicking the button or a button in the area it outlines, does its job and counts as Got it; so does choosing Got it or pressing Enter. The next hint waits until your next click or key press, so you can first do what the hint showed.
- Choose Not now or press Escape to pause hints for the current function visit without acknowledging anything. Switching Analysis Tabs does not resume them; leave the function and return to retry the earliest eligible unacknowledged hint.
- Contextual Hints are turned off, and back on, under Settings → Guidance. A hint's Turn off hints… shows the way there: it points at the Settings gear at the top right, then Settings points out Guidance and the Show contextual hints option, which you untick yourself. The same page can reset acknowledgement history for the current user, causing eligible hint versions to appear again on this device.
- A replayable Guided Tour is shown in Help only when one is available. A tour is started deliberately and is unaffected by the Contextual Hint switch.
-
Suggestions appear when a result or run looks off, with a lightbulb
beside it, and a pulsing border marks the settings that may help while the
suggestion shows. They never stop you and need no closing: they fade once
you carry on with other things (typing in a field does not count), or choose
Dismiss to close one at once. Either way it comes back when the same
situation happens again. Buttons that lose work, such as
Clear and Stop, are named but never marked. Suggestions appear when:
- a Concordance Preview finds no matches in the documents it checked, while the Data Block has more: show more Documents per page, or Run to search them all;
- Topic Modelling puts most passages in one topic (try a lower Max topic size), finds only a few topics, or leaves 30% or more of the documents Ungrouped (under Advanced, set Ungrouped passages to Join a topic they fit), then Run again;
- a Topic Modelling run is still splitting or reading the text after five minutes: reading takes most of a first run, so Stop, then lower Sampling to read fewer documents;
- a Topic Modelling input is large (from about 15,700 documents or 66,000 passages): a sample of documents or passages gives a faster first run;
- a Trends rate divides by a reference Data Block that lacks one of the Group By columns, so its groups share each period's total: the note under the chart says which columns the totals are grouped by.
- Clicking a disabled Run outlines what it is waiting for, such as an empty Tokeniser model in Frequency.
- Suggestions are turned off, and back on, under Settings → Guidance (Show suggestions). A suggestion's Turn off suggestions… shows the way there, as Turn off hints… does.
A regular expression is a short pattern that describes the text you are looking for, rather than the exact text itself. For example, one pattern can find both colour and color, every year written as four digits, or every tweet that starts with a retweet marker. Wordflow uses them wherever you see Use regular expression (Concordance's Text mode, and Find & replace, Extract text, and Count in the Data Editor), in the Data Builder's Filter when regular expression is ticked on a contains condition, and in Segment's A pattern option. When the box is not ticked, the text is matched exactly as written.
| Pattern | What it matches |
|---|---|
colou?r |
colour or color (? makes the letter before it optional) |
labou?r(er)?s? |
labour, labor, labourer, labourers, labours, and so on |
^RT @ |
Texts that start with RT @, such as retweets (^ means the very start; in Segment it means the start of each line) |
[0-9]{4} |
Any four digits in a row, such as a year like 1901 |
\bjob(s)?\b |
The whole word job or jobs, but not jobless (\b marks the edge of a word) |
tax|budget|welfare |
Any one of the three words (| means "or") |
Some characters have a special meaning: . ? * + ( ) [ ] { } ^ $ | \. To match one of them as an ordinary character, put a backslash before it, for example \. for a full stop or \? for a question mark.
Wordflow's patterns follow the Rust regular expression syntax. It covers everyday patterns, but it does not support look-ahead or look-behind (such as (?=...) or (?<=...)). For a quick overview of the symbols, see the MDN regular expressions cheat sheet. To try a pattern on your own text before using it, paste both into regex101.com and choose the Rust flavour.